Wave pattern
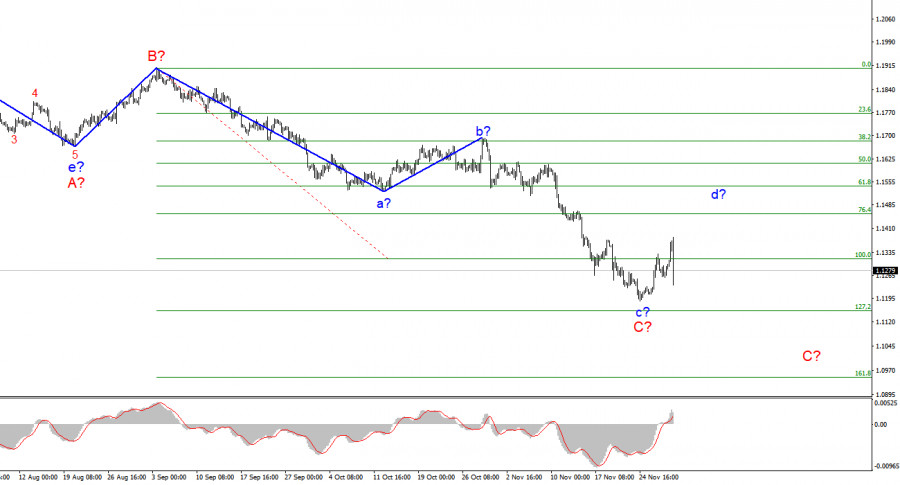
The wave layout for EUR/USD on the 4-hour chart remains complete and does not require any changes. The a-b-c-d-e section of the trend, which was formed at the very beginning of the year, should be interpreted as a wave A, and the subsequent rise in the instrument is seen as a wave B. Thus, the formation of the assumed wave C continues and can take a very extended form. Then we have an interesting situation. The rebound of the quotes from the recent lows suggests that the formation of the expected wave c in C is completed. If this is true, then a new ascending wave is being formed at the moment, presumably the wave d in C. The C wave may take a five-wave corrective structure. A successful attempt to break through the 100.0% Fibonacci level will indicate that the market is ready to go bullish on the instrument. Another scenario is possible when the C wave will take a three-wave form and turns out to be completed. In any case, quotes are expected to rise in the coming week.
Omicron high on the agenda but inflation is also in focus
The news background for EUR/USD was rather weak on Tuesday as only one important report was published during the day. We are talking about the eurozone inflation report for November. Just like in the US, the CPI continues to accelerate: it jumped to 4.9% in November from 4.1% in October. Thus, Christine Lagarde's fears about further inflation growth were not in vain. Still, Christine Lagarde and Jerome Powell continue to insist that inflation will decrease next year as soon as supply chains recover and energy prices stabilize. However, none of them mention the highest rate that inflation could reach before it starts to slow down. After all, this is a very important question since the US consumer price index has already hit its highest level in 31 years. The same could happen in Europe if the ECB does not reduce the PEPP stimulus program. Amid the emergence of a new virus strain last week, the central banks of the EU and the United States said that this could pose an additional threat to the global economy: it may shrink if Omicron is really as dangerous as reported. So, instead of monetary policy tightening, an opposite process may begin. It is hard to say for sure how things will develop as Omicron has just been discovered. Yet, many countries worldwide have already reported cases of the new virus infection.
Conclusion
Based on the analysis above, I can conclude that the descending C wave has been completed. However, a drop in euro quotes yesterday suggests that the assumed wave d is unlikely to continue its formation. Such sharp movements usually change the wave structure. So it is better to wait a few days to observe the behavior of markets and the instrument.

Higher time frame
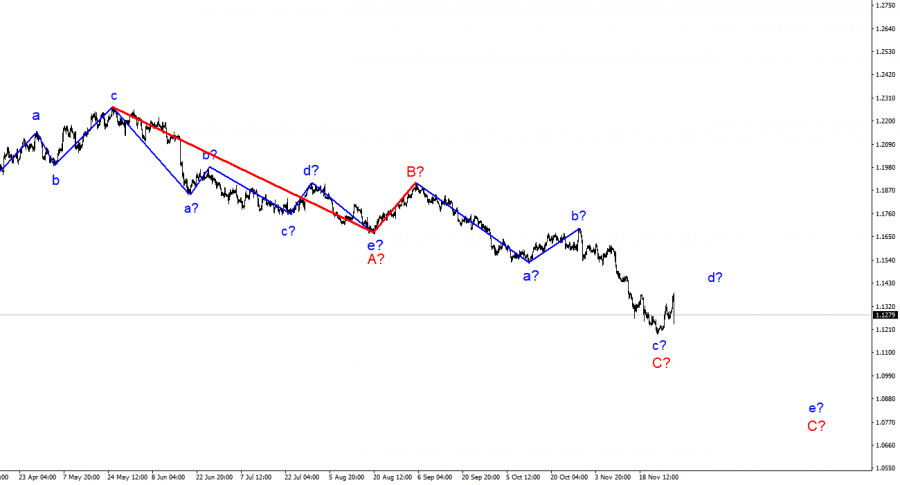
The wave layout on the higher time frame looks quite convincing. The quotes continue to move lower. The descending section of the trend that was initiated on May 25 takes the form of a three-wave correctional pattern A-B-C. This means that the downtrend may continue for another month or two until the C wave is fully completed. It can have either a three- or a five-wave structure.
The material has been provided by InstaForex Company - www.instaforex.comfrom RobotFX


 Download NOW!
No comments:
Post a Comment