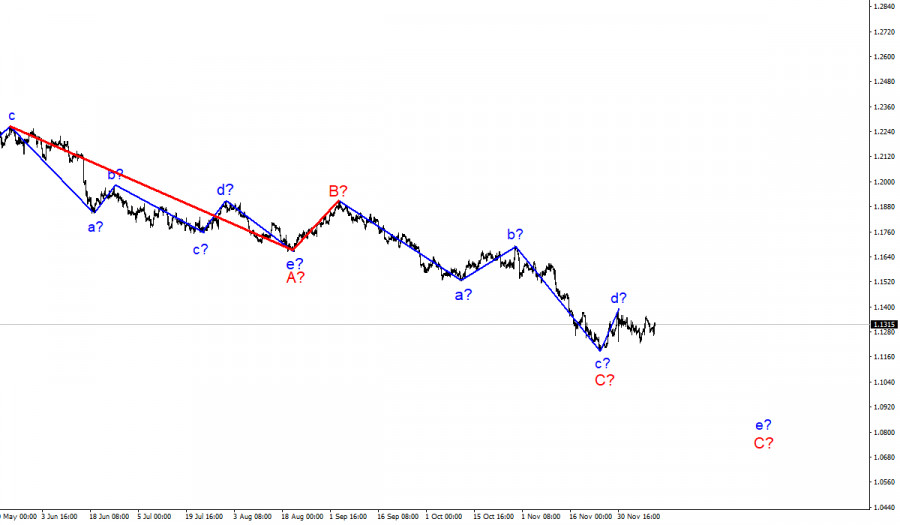
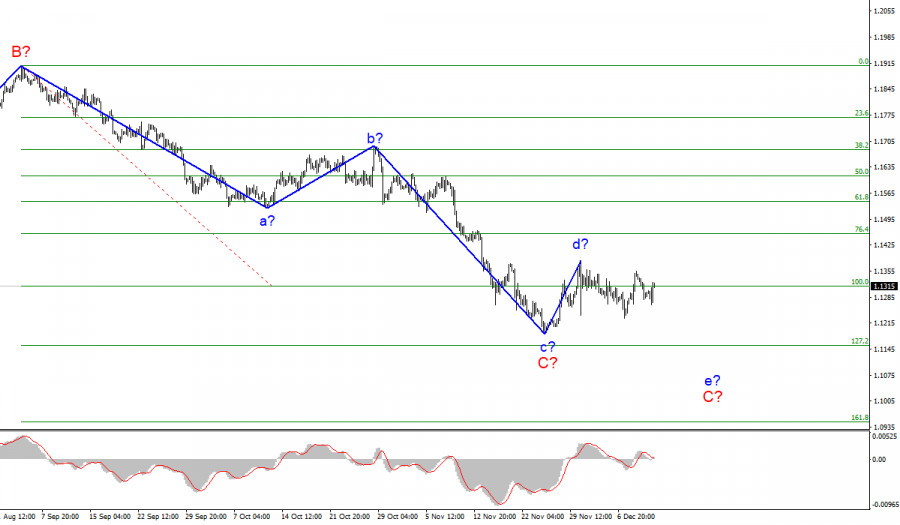
Wave pattern.
The wave marking of the 4-hour chart for the euro/dollar instrument continues to remain integral and does not require any changes. At this time, the construction of the proposed wave C is continuing, which is likely to take a five-wave form. Presumably, the construction of an upward wave d-C. And, if the current wave marking is correct, the internal wave e-C is being built now, and a successful attempt to break through the 100.0% Fibonacci level indicates the readiness of the markets for new sales of the instrument. Thus, the decline of the instrument may continue next week with targets located near the estimated mark of 1.1152, which is equivalent to 127.2% by Fibonacci, where the entire trend section can complete its construction. I also draw attention to the fact that wave C takes a corrective form. And the entire downward section of the trend, which originates in January 2021, may take not a three-wave, but a five-wave form A-B-C-D-E. However, it will be possible to talk about this when at least wave C completes its construction.
Inflation in the US rose to a record 6.8%.
The news background for the EUR/USD instrument was strong on Friday. And all this strength was only in one report – inflation in the United States. In the morning, ECB President Christine Lagarde gave a speech in the European Union, but, as often happens, Lagarde did not talk about the economy or monetary policy. Or the markets have not received any fundamentally new information. In general, there was no reaction to her speech. Thus, since Thursday, the markets have fully focused their attention on the report on American inflation, and when it came out on Friday, they seemed confused. The consumer price index rose to 6.8% y/y in November. And this value fully corresponded to market expectations. And this factor seems to have restrained the markets from new purchases of the US currency. Previously, when inflation either exceeded the forecast or simply grew, the dollar often rose. However, on Friday, on the contrary, it decreased. The instrument increased by 25 basis points at the end of the day and at this time it is not entirely clear whether wave d is completed? Under certain circumstances, this wave may take on a more extended form. However, at this time it also looks quite complete. The US currency missed a great opportunity on Friday to continue the increase, which would fully correspond to the current wave markup. However, the ECB and the Fed will meet next week, so it is almost impossible to predict where the instrument will be by its end. One thing is for sure – we are in for a very interesting week.
General conclusions.
Based on the analysis, I conclude that the construction of the descending wave C can be completed. However, the internal wave structure of this wave inclines me more and more to the opinion that another descending wave e will be built. Thus, I advise selling the instrument with targets located around the 1.1152 mark, for each MACD signal "down".

Senior schedule.
The wave marking of the higher scale looks quite convincing. The decline in quotes continues and now the downward section of the trend, which originates on May 25, takes the form of a three-wave correction structure A-B-C. Thus, the decline may continue for at least a few more weeks until wave C is fully completed (it should take a five-wave form in this case).
The material has been provided by InstaForex Company - www.instaforex.comfrom RobotFX


 Download NOW!
No comments:
Post a Comment