Long positions on GBP/USD:
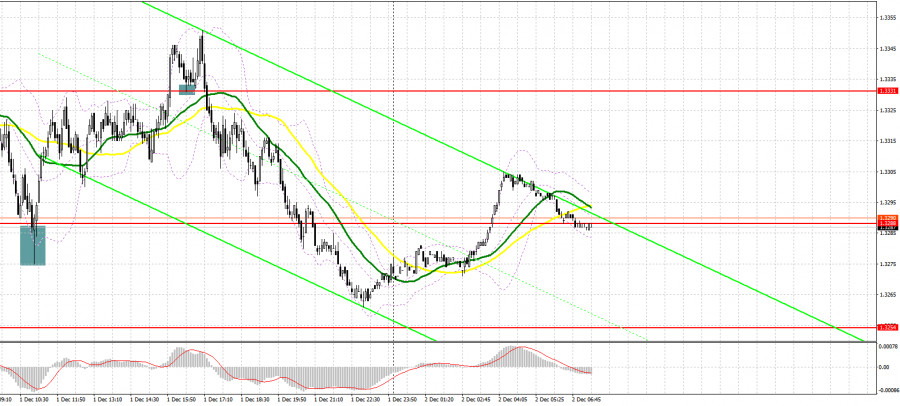
Sellers were stronger than buyers yesterday because they were able to break the support level of 1.3288. Let's switch to the M5 chart and analyze the signals produced. In my previous morning review, we focused our attention on the level of 1.3288 that was a nice entry point. The pound sterling fell after the release of disappointing data on the manufacturing PMI that came shy of market expectations. As a result, a false breakout was formed at around 1.3288, producing a buy signal. So, the quote returned to the high of 1.3331. In the second half of the day, GBP bulls broke through 1.3331. A test of this mark from top to bottom formed an excellent buy entry point. Nevertheless, the pair did not show considerable growth. After rising by 15 pips, the pound came under pressure again.

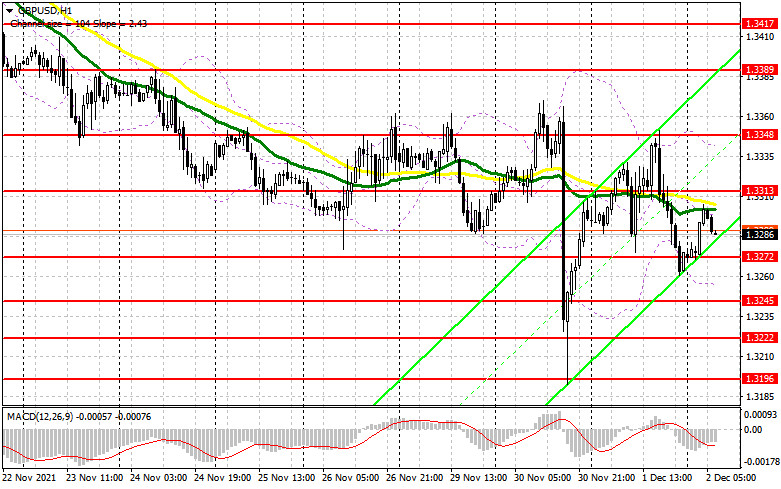
Due to an empty macroeconomic calendar in the United Kingdom, the sterling is likely to continue being under pressure today. The comments Governor Andrew Bailey made yesterday did not instill optimism in bulls. To regain control over the market, bulls should break through 1.3313 where bearish moving averages are located. A test of this level from top to bottom could generate a buy signal. Consequently, a bearish impulse might stop and GBP/USD might recover to 1.3348 (the upper boundary of the sideways channel. Targets are also seen at the high of 1.3389, where traders could lock in profits, and at the resistance level of 1.3417. If the pound goes down during the European session, long positions could be opened after a false breakout of the lower boundary of the sideways channel at 1.3282. Traders could also buy GBP/USD on a bounce from the low of 1.3245 or at around 1.3222, allowing 20-25 pips intraday correction.
Short positions on GBP/USD:
The trend is still bearish. So far, there have been no signs of a reversal. Bears should protect the resistance of 1.3313. A false breakout at this level is likely to produce a new sell entry point with the target seen at the lower boundary of the sideways channel (1.3272). Technically, this is a very important mark. A breakout there could make trading harder for bulls. Meanwhile, a retest of this level from bottom to top could generate an excellent entry point, and the pair could head towards new lows: 1.3245 and 1.3222 where traders could lock in profits. A further target is seen at the support level of 1.3196. If the quote shows growth during the European session and there is a lack of bearish activity at 1.3313, short positions could be opened only after the price has reached the resistance level of 1.3348 (the upper boundary of the sideways channel) and only after a false breakout. Traders could sell GBP/USD on a bounce from the resistance level of 1.3389 or the high of 1.3417, allowing a 20-25 pips intraday correction.

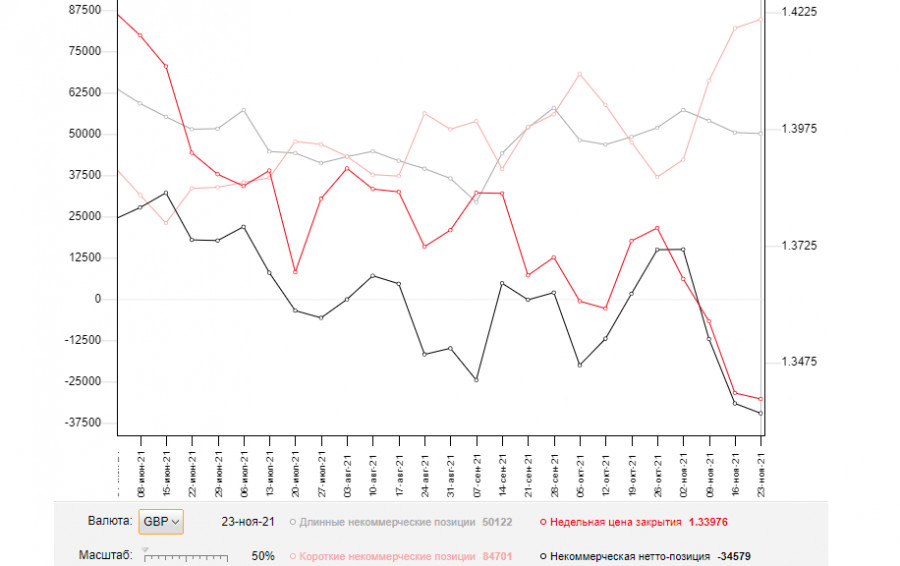
The COT report as of November 23 logged an increase in short positions and a decrease in long ones, which led to a negative delta. Dovish statements of Governor Andrew Bailey made last week keep exerting pressure on the pound sterling despite risks of higher-than-expected inflationary pressure. In addition, pressure on the pound sterling increased amid the spread of the Omicron variant, as well as a sharp rise in the infection rate, in Europe. The issue of the Northern Ireland protocol that the UK authorities are planning to suspend in the near future is another negative factor for the pound. At the same time, inflation is accelerating in the United States. The expectations that the Federal Reserve could announce raising interest rates earlier next year provide strong support for the greenback. Nevertheless, traders should stick to the strategy of buying the pair after sharp drops in value that are likely to take place due to the central bank's unclear stance on monetary policy. The COT report showed that long non-commercial positions declined to 50.122 from 50,443, while short non-commercial positions rose to 84,701 versus 82,042. This led to a decrease in the negative non-commercial net position: -34,579 from -31,599 a week earlier. The weekly closing price fell to 1.3410 from 1.3410.

Indicator signals:
Trading is carried out below the 30-day and 50-day moving averages, indicating the beginning of a downtrend.
Moving averages
Note: The period and prices of moving averages are viewed by the author on the hourly H1 chart and differ from the general definition of classic daily moving averages on the D1 chart.
Bollinger Bands
In case of a bullish movement, the pair is likely to encounter resistance at 1.3340 (the upper band). Otherwise, if the quote goes down, the pair could find support at 1.3260 (the lower band)
Indicator description:
- Moving average (MA) determines the current trend by smoothing volatility and noise. Period 50. Colored yellow on the chart.
- Moving average (MA) determines the current trend by smoothing volatility and noise. Period 30. Colored green on the chart.
- Moving Average Convergence/Divergence (MACD). Fast EMA 12. Slow EMA 26. SMA 9.
- Bollinger Bands. Period 20
- Non-commercial traders are speculators such as individual traders, hedge funds, and large institutions who use the futures market for speculative purposes and meet certain requirements.
- Long non-commercial positions are the total long position of non-commercial traders.
- Non-commercial short positions are the total short position of non-commercial traders.
- Total non-commercial net position is the difference between short and long positions of non-commercial traders.
from RobotFX


 Download NOW!
No comments:
Post a Comment