Hello, dear colleagues!
Gold, silver, and platinum have become a disappointment in 2021. Indeed, at the end of last year, these precious metals were projected to show continuing growth. However, all these forecasts were never destined to come true. As a result, gold has lost 5.5%, silver has tumbled by 15%, and platinum has plunged by 12% by the end of this year. In this article, we will look at the prospects for the precious metals market for the first quarter of 2022 and outline the most likely trend directions.
Speaking of the precious metals market, we need to understand that gold is the major driving force behind the movements of all precious metals. The only exception is palladium. At the same time, it is an industrial metal rather than a precious one, so we will not be talking about it in this article. Let us now dwell on some fundamental issues about gold, silver, and platinum.
If the liquidity of the gold market is taken as 1.0, the liquidity of the silver market will be 0.25, and that of the platinum market will be 0.1, because the gold market is ten times larger than the platinum market, and the silver market is four times smaller than the gold market. These ratios occasionally change - increase or decrease.
So, market liquidity is a very important indicator. In fact, the higher the liquidity, the less the volatility, and vice versa. Therefore, when trading in the precious metals market, traders should understand that the silver and platinum markets should always be analyzed together with the gold market.
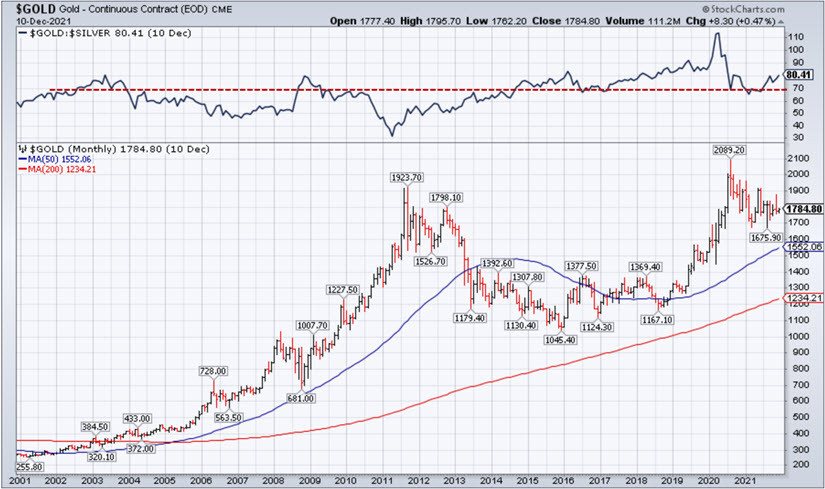
If we look at the correlation between the precious metals, the ratio between the value of gold and the price of silver has been hovering around 70 for the last 20 years (Fig. 1). Since 2014, silver has been undervalued in relation to gold. In the case of platinum, the picture is more complex. Indeed, in the competition between gold and platinum, gold is always in the lead and is constantly increasing the gap between the two precious metals. Therefore, in terms of the relative strength of gold, silver, and platinum, investors see gold as a more attractive instrument at least until the ratios become very critical, as it happened to silver in the summer of 2020. Back then, the relative strength of gold and silver hit the highest level and exceeded 110. Then, amid a decline in the value of gold, the relative strength again returned to 70.

Fig. 1: Monthly chart of gold, 2000-2021
Traders rarely turn to monthly charts when trading, but in this case, it is important to analyze them. As we can see, gold is in an uptrend above its 4-year and 20-year moving averages. Notably, the price may stay in this range for a long time. For instance, gold was traded in the range of $1,050- $1,370 between 2013 and 2019, that is for 6 years. That is why, at the very least, investors need patience.
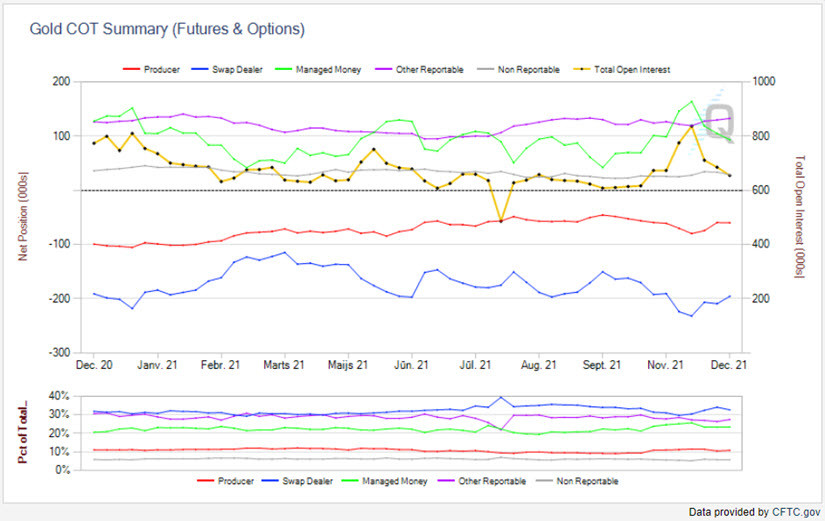
Anyway, traders are free to earn even in a range. So, the state of the futures market will be the main fundamental factor affecting the price for them. In this case, they should focus on the analysis of futures, options, as well as the Commitment of Traders report (Fig. 2).

Fig. 2: Gold COT Summary
The yellow line on the chart is of utmost importance. It denotes supply and demand, the so-called Open Interest. As we can see, demand for gold fell by 182,000 positions in the past 4 weeks. So, it plummeted to 655,000 versus 873,000, losing one-fifths of positions in a month.
In July-August, the value of gold dropped to $1,675 from $1,837 per troy ounce. In May-August, Open Interest started to fall. Between mid-May and August 3, 2021, Open Interest plunged to 485,000 from 751,000. Back then, gold tumbled to $1,726.50 versus $1,909.20 (Fig. 3).
Another important indicator of demand affecting the price is the number of net positions, the so-called Managed Money. These are trend-following buyers. The net positions of this group of traders fell to 44,000 from 164,000 in 4 weeks, which indicates that buyers are fleeing the market and increasing their short positions. This is an alarming signal.

Fig 3. Line Break chart
I would like to point out that Chart 3 looks unusual due to the very interesting way of displaying the closing prices by breaking three lines - 3 Line Break. This method deserves your special attention because it filters noise and reflects the current price of gold, or any other asset, by missing minor deviations against the current trend.
According to the 3 Line Break method, the downward correction will be broken only when the closing price goes above the three lines. In our case, the closing price should reach $1,806. At the same time, we can see that the lowest closing price formed an extremum at $1,762.70, thereby updating the previous low of $1,763.90. This means that the gold has been retracing down since November 2021 and is about to turn into a new downtrend. The target is seen at the low of $1,722.90. Moreover, the cumulative dynamics of Open Interest and Managed Money give the same outlook.
So, these are going to be challenging times for gold buyers. If the situation does not change in the near future, the price is highly likely to decline to $1,720 with targets at $1,680 and $1,620.
At the same time, there is still hope that the precious metal may rise. High inflation and risk aversion could fuel interest in gold among American and European investors. But, before that, gold should update the latest three closing prices, with the target at $1,870. Nevertheless, the price is more likely to fall rather than rise. So, when entering short positions, such a possibility should be taken into account. Another important factor is the upcoming FOMC meeting that could drastically change the situation in the market. Then, winter holidays will follow, which could make the precious metals market even more volatile. That is why traders should now trade cautiously and stick to money management rules.
The material has been provided by InstaForex Company - www.instaforex.comfrom RobotFX


 Download NOW!
No comments:
Post a Comment