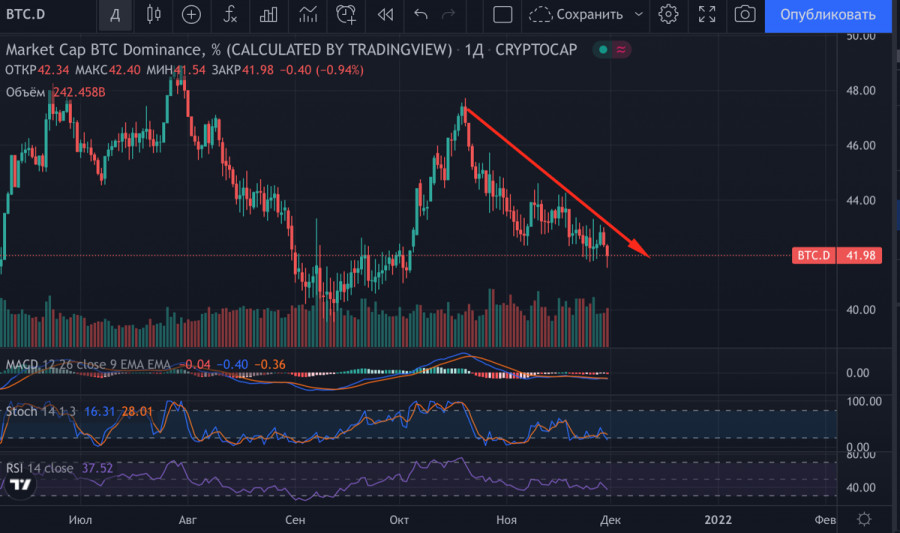
Thanks to a combination of two important factors, Ethereum has resumed its bullish rally and is heading towards a new historical record. The first important prerequisite for ETH's rapid growth is the successful holding of the area above $4.3k, which set the market up for a bullish scenario. The second factor that allowed ether to begin its upward movement was the bitcoin's sagging dominance, which gave ether an opportunity for price movement.

In addition, the fundamental news backdrop was also strengthened by positive news on Ethereum. First of all, it is worth mentioning that a record 4 million users of decentralized applications and platforms on the ETH blockchain were reached. Many experts have noted that the growth of Ethereum is directly linked to the development of related projects. It has also been reported that Kelly Strategic Management has applied to the SEC for a futures ETH ETF. Given the great success of the futures exchange-traded fund on bitcoin, investors reacted positively to the news, so the coin's exchange rate started to go up.
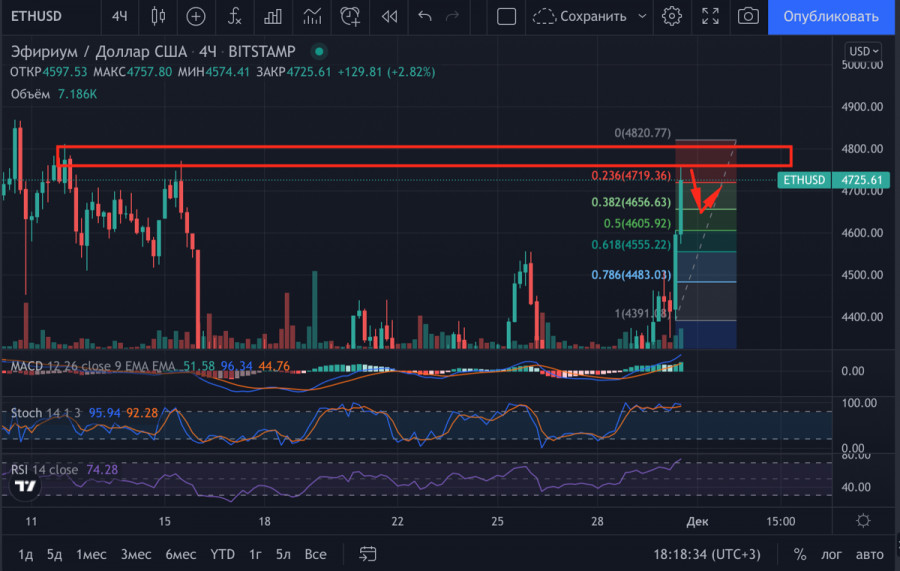
Notably, Ethereum has started an impulsive growth, which can be identified by the long body of the candle. Such a spike in value is characterized by the formation of several long candles in a row. Therefore, a price pullback follows after the impulse is completed. In most cases, the potential for price movement in the opposite direction from the momentum movement is equal to the Fibonacci level. It is worth drawing on the narrow chart from the beginning of the momentum moving to its end. I drew the levels based on the fact that most of the structure of the sharp rise has been formed and the upward movement will soon start to slow down. Therefore, the levels are drawn from the start of the rally to the absolute high line, where the price is likely to start to pull back.
There are two conditions that make good profits on pullbacks after an impulse rise: the correct drawing of Fibonacci levels and the important rule of candlestick analysis. Having drawn levels from the beginning to the end of an impulse growth, the rule, according to which the middle of a long candle is a good support zone, should be followed. In combination with Fibonacci levels, this information allows you to determine the potential for price movement. As for Ethereum, a pullback is likely from the Fibonacci level of 0.236 to $4650, where the Fibonacci level of 0.382 and the middle of the big green candle is located. With stop-losses slightly above the previous high, one can preserve capital in case of a price reversal or continued upward movement, while take-profit can keep profits around $4.6k to avoid waiting for a price rebound upwards.

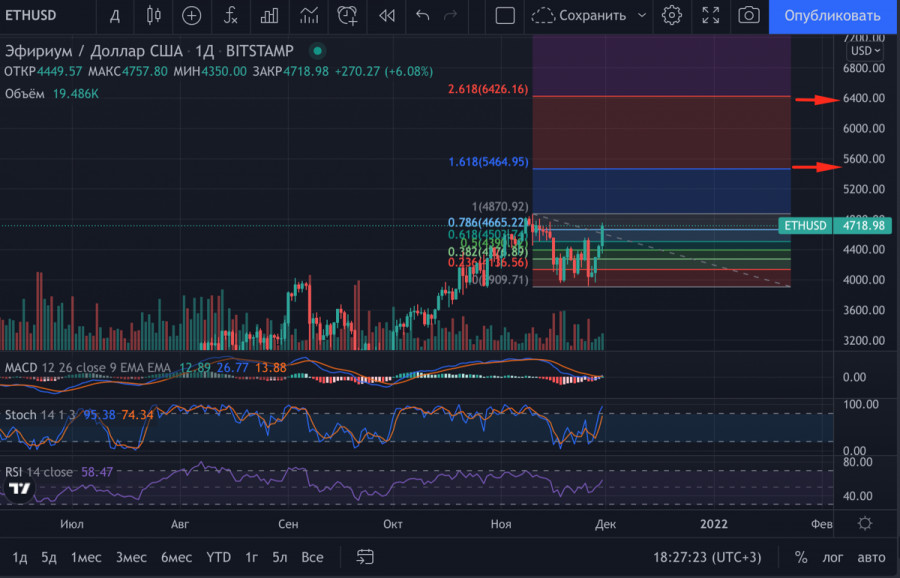
To determine the prospect of price movement within the current bullish rally of Ethereum, the Fibonacci levels on the daily timeframe need to be drawn. The initial point will be the start of the correction, i.e. the current all-time high of November 10. The final point will be the low of $3.9k on November 26. With this action, we see that the nearest target outside the current ATH is $5.4k, where the Fibonacci level of 1.618 passes. Most likely, the final bull market point for Ethereum will be the $6.4k mark, where the 2.618 Fibonacci level line is located.

from RobotFX


 Download NOW!
No comments:
Post a Comment