The EUR/USD pair continued to trade quietly on Wednesday until the U.S. inflation report. However, the inflation report did not change much for the U.S. dollar. Right off the bat, the Consumer Price Index rose to 2.7% year-on-year, as expected. Core inflation remained at 3.3%, as predicted. Thus, there were no deviations from forecasts, so the market had nothing to react to.
The fact that inflation in the U.S. is accelerating brings the Federal Reserve closer to pausing in December, but it has not grown so much that we should panic about it. If the Fed decides to lower the rate by another 0.25% in December, it should not surprise anyone. Inflation is rising, and that's bad, but the Fed's monetary policy remains restrictive, so it will continue to put upward pressure on prices.
Also of note is the stance of some of the Fed's monetary committee representatives, who allow even a key rate hike if necessary. Simply put, the U.S. central bank is not just focused on easing (as the market wanted in the last two years); it is focused on achieving the inflation target. And if this requires tightening policy, it will take this step.
For the American currency, such news is like New Year's and Christmas gifts. The market was setting up for 6-7 stages of policy easing only in 2024, and in the end, it may not even get three. The market expected that the rate would fall by 1.5% only this year, but it may not even get 1%. At the same time, the European Central Bank will not stop there and is almost guaranteed to lower rates in December. Thus, even if the Fed also cuts the rate, the euro will remain at a greater disadvantage.
In addition, we still do not believe that the market has balanced the dollar exchange rate after a two-year decline, which is a correction. On the weekly TF (even without any indicators), we see that the price fell and then corrected. Hence, a new downtrend is starting now. Even if this is not the case, and we, on the contrary, are inside a new uptrend that began in 2022, some technical grounds or signals are needed to identify a new trend. Since there are none now, expecting the euro currency to grow to $ 1.20 and above makes no sense. We are not even talking about the fact that there are no fundamental reasons for such growth. The dollar and the American economy still look stronger than the euro and the EU.

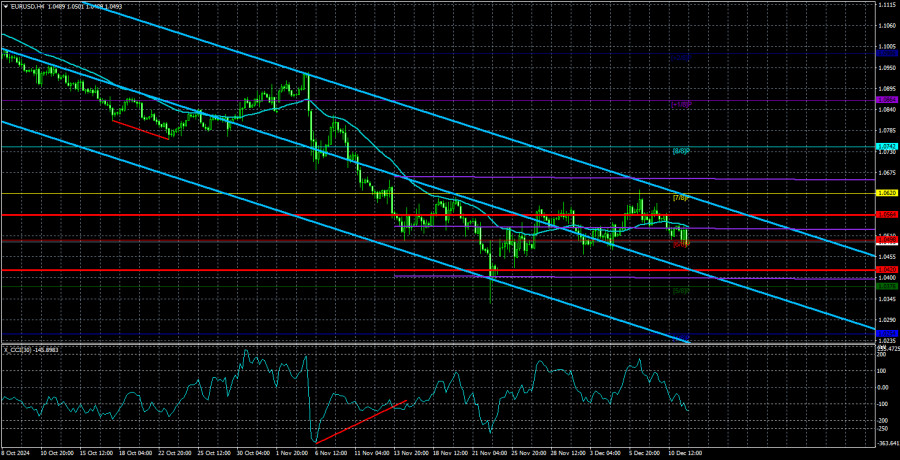
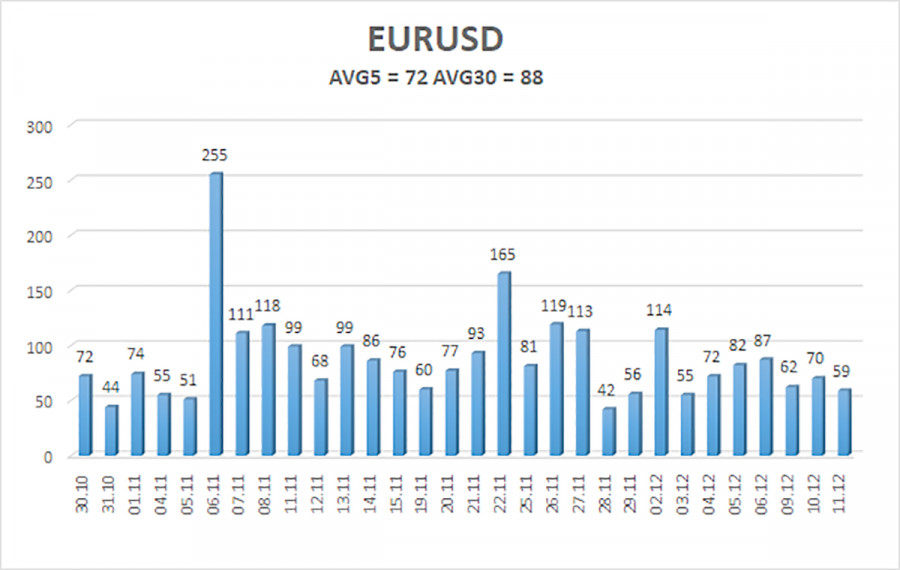
The average volatility of the EUR/USD currency pair over the last five trading days as of December 12 is 72 pips, classified as "average." For Wednesday, we expect the pair to move between 1.0420 and 1.0564. The higher linear regression channel is directed downward, indicating that the global downtrend remains intact. The CCI indicator has entered the oversold zone several times, triggering a corrective rebound that is currently ongoing.
Support Levels:
S1 – 1.0498
S2 – 1.0376
S3 – 1.0254
Resistance Levels:
R1 – 1.0620
R2 – 1.0742
R3 – 1.0864
Trading Recommendations:
The EUR/USD pair could resume its downtrend at any time. For months, we've consistently maintained a bearish outlook for the euro in the medium term and fully support the overall downward trend. There is a high likelihood that the market has already priced in all, or nearly all, of the Fed's anticipated rate cuts. If this is the case, the dollar still has no substantial reasons for a medium-term decline, although there were few of them before. Short positions can be considered targeting 1.0420 and 1.0376 if the price is below the moving average. If you are trading purely on technical signals, longs can be considered when the price is above the moving average, targeting 1.0620 and 1.0636. However, we do not recommend long positions at this time.
Explanation of Illustrations:
Linear Regression Channels help determine the current trend. If both channels are aligned, it indicates a strong trend.
Moving Average Line (settings: 20,0, smoothed) defines the short-term trend and guides the trading direction.
Murray Levels act as target levels for movements and corrections.
Volatility Levels (red lines) represent the likely price range for the pair over the next 24 hours based on current volatility readings.
CCI Indicator: If it enters the oversold region (below -250) or overbought region (above +250), it signals an impending trend reversal in the opposite direction.
The material has been provided by InstaForex Company - www.instaforex.comRobotFX


 Download NOW!
No comments:
Post a Comment