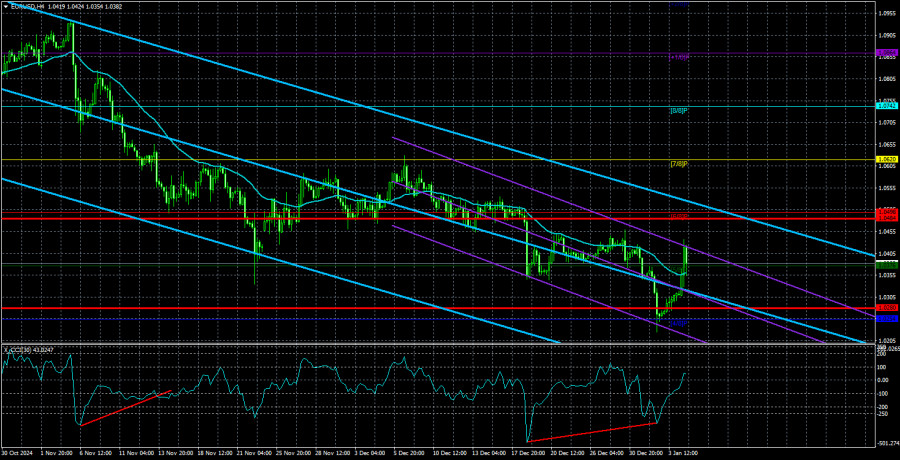
The EUR/USD currency pair experienced a notable increase on Monday. Interestingly, there were no clear reasons for this movement, particularly in the first half of the day. Last Thursday, the first trading day of the new year, both the euro and the pound had a dramatic decline. On Friday, the market largely overlooked the strong ISM index from the US. However, on Monday, both currency pairs unexpectedly showed impressive gains. This leads to the conclusion that the market is currently facing chaotic and illogical movements, and it is reasonable to assume this could be a technical correction.
From Friday to Monday, the fundamental and macroeconomic conditions remained unchanged. The euro has been in decline for three months, and there is no reason it couldn't continue to fall for another three months. Nevertheless, the price closing above the moving average line suggests that the downward trend has paused. This correction could extend further, potentially reaching the 1.0600 level or even slightly higher. To assess the potential strength of this correction, it is useful to analyze the daily timeframe. The daily chart illustrates the severity of the recent downward trend and indicates a near-total lack of corrections. Therefore, it is fair to say that the target area of $1.00–1.02 has been approached (though the price fell short by just 22 pips), and a prolonged consolidation phase is likely to follow.
We would like to remind traders that, despite the strength or duration of the correction in the coming weeks, it does not indicate the end of the 16-year-long downtrend. Since the fundamental conditions remain unchanged, we see no reason to expect the euro to rise to the 1.1000 level or higher. Recent trading data over the past two days has shown that US data remains robust, while European data continues to underperform.
This week, US data may disappoint, while the euro could gain support from inflation reports. However, we want to emphasize Monday's unexpected rise in the euro; it should not have occurred, and Friday should have seen further strengthening of the dollar. Such market behavior suggests that the current phase of the downtrend may be concluding. For renewed dollar buying to take place, the upcoming US labor market and unemployment data must demonstrate exceptionally strong results.
Discussing a long-term perspective at this stage is unproductive. On January 20, Donald Trump will officially take office as President of the United States, and it is uncertain what actions he will implement and when. The fundamentals could change in the near future, and this will inevitably be reflected in the charts of major currency pairs.

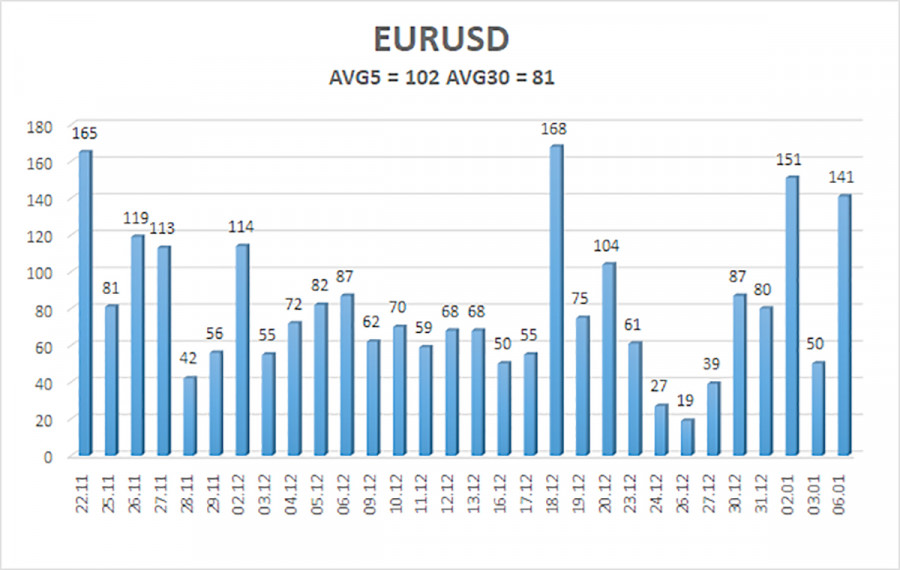
The average volatility of the EUR/USD currency pair over the past five trading days as of January 7 is 102 pips, characterized as "high." On Tuesday, we expect the pair to move between the levels of 1.0280 and 1.0484. The higher linear regression channel points downward, indicating that the global downward trend persists. The CCI indicator has once again entered the oversold area and formed a new bullish divergence, but this signal continues to suggest, at most, a correction.
Nearest Support Levels:
- S1 – 1.0376
- S2 – 1.0254
- S3 – 1.0132
Nearest Resistance Levels:
- R1 – 1.0498
- R2 – 1.0620
- R3 – 1.0742
Trading Recommendations:
The EUR/USD pair appears to be continuing its downward trend. For several months, we have consistently anticipated a decline in the euro over the medium term, and we firmly support this overall bearish outlook, which we believe is far from over. The likelihood that the market has already priced in all future Federal Reserve rate cuts is high. As a result, the dollar currently lacks substantial reasons for medium-term depreciation apart from purely technical corrective factors.
Short positions are still relevant, with target prices of 1.0280 and 1.0254 if the price falls back below the moving average. If you are using "pure" technical analysis, long positions may be considered if the price rises above the moving average, with a target of 1.0484. However, any upward movement at this stage is considered a correction.
Explanation of Illustrations:
Linear Regression Channels help determine the current trend. If both channels are aligned, it indicates a strong trend.
Moving Average Line (settings: 20,0, smoothed) defines the short-term trend and guides the trading direction.
Murray Levels act as target levels for movements and corrections.
Volatility Levels (red lines) represent the likely price range for the pair over the next 24 hours based on current volatility readings.
CCI Indicator: If it enters the oversold region (below -250) or overbought region (above +250), it signals an impending trend reversal in the opposite direction.
The material has been provided by InstaForex Company - www.instaforex.comRobotFX


 Download NOW!
No comments:
Post a Comment