EUR/USD 5-Minute Analysis

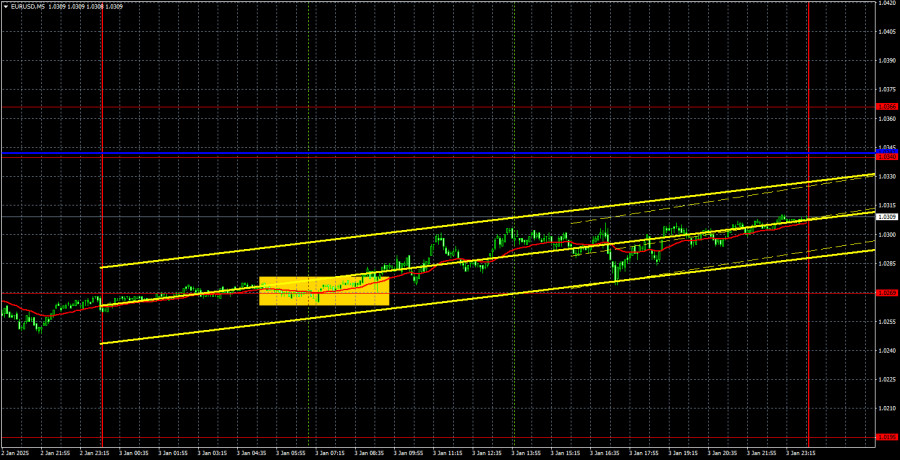
The EUR/USD pair continued its sluggish upward correction on Friday, following a sharp decline on Thursday. However, this recent rise in the euro does not indicate any significant change; it is merely a correction or pullback with minimal chances of developing into something more substantial. Every trend eventually comes to an end, but for now, there is no reason to believe that the current bearish trend will conclude. During the holiday period, the EUR/USD pair consolidated effectively, but the trend has since resumed. As mentioned throughout 2024, we still expect the euro to trade within the $1.00–$1.02 range, which has nearly been reached.
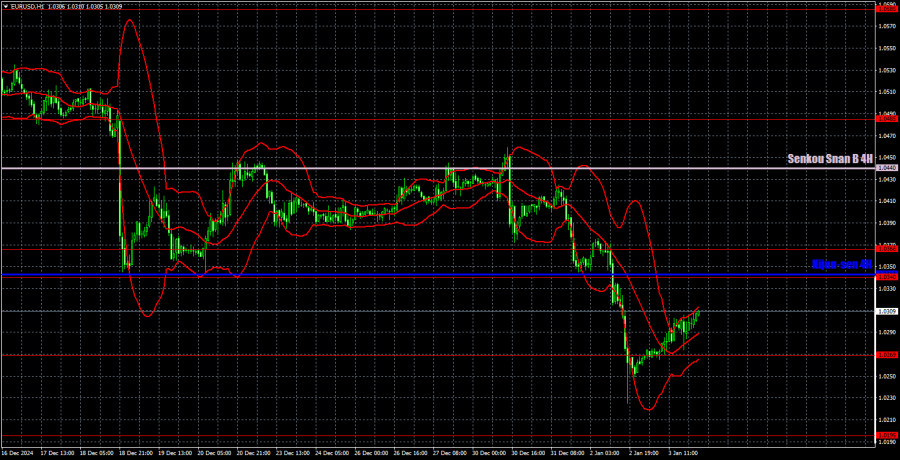
On Friday, the U.S. dollar could have continued its upward trajectory. The only notable report, the ISM Manufacturing PMI, exceeded expectations, giving the market a reason for further dollar buying. However, the market may have lacked the momentum needed to sell off the euro for a second consecutive day. The technical picture on the hourly time frame still suggests potential further declines. The pair could correct towards the critical line, and the bearish trend is likely to persist.
On Friday, there was only one trading signal within the 5-minute time frame. During the European trading session, the price rebounded from the 1.0269 level, rising by 30 to 40 pips by the end of the day. Although this was not a significant movement, it presented an easy profit opportunity. No additional trading signals appeared throughout the day. Moreover, the upward trend may continue into Monday and Tuesday, with the price potentially reaching the 1.0340 level, where the critical Kijun-sen line is located.
COT Report

According to the latest Commitment of Traders (COT) report, dated December 24, there has been a change in the positioning of non-commercial traders. While their net position had remained bullish for an extended period, bears have recently taken the lead. Two months ago, the number of short positions among professional traders surged, resulting in a net position that has become negative for the first time in a long time. This indicates that the euro is now being sold more frequently than it is being bought.
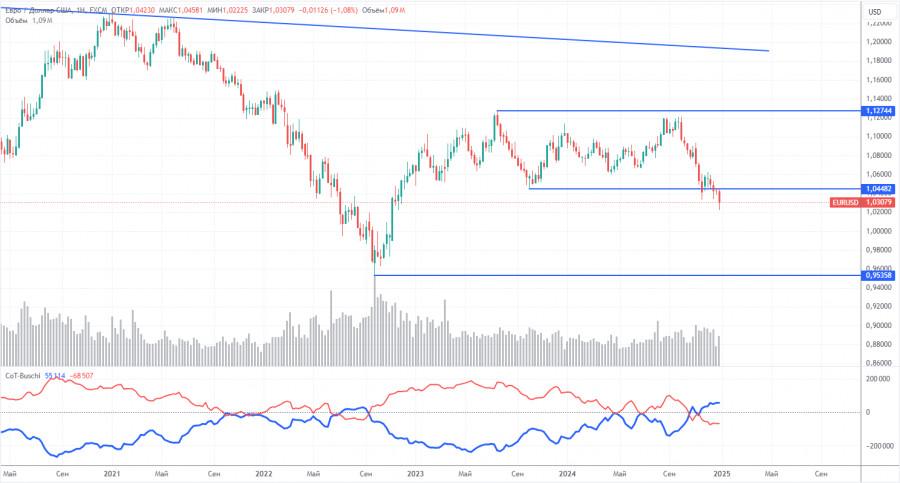
We still do not see any fundamental factors supporting the strength of the euro. For an extended period, technical analysis has indicated a consolidation zone, leading to a sideways market. On the weekly time frame, it is clear that since December 2022, the currency pair has been trading between 1.0448 and 1.1274. However, the recent break below the 1.0448 level has created new opportunities for further declines.
Currently, the red and blue lines in the COT chart have crossed each other and switched positions, signaling a bearish market trend. During the latest reporting week, the number of long positions in the "non-commercial" group increased by 6,800, while short positions grew by 9,400, leading to a further decline in the net position of 2,600.
EUR/USD 1-Hour Analysis

In the hourly timeframe, the currency pair has resumed its downward trend. We believe this decline will continue in the medium term. The Federal Reserve is expected to lower interest rates only 1 to 2 times in 2025, which indicates a more hawkish stance compared to what the market has already priced in. We see no justification for significant strength in the euro.
On January 6, we highlight the following levels for trading - 1.0195, 1.0269, 1.0340-1.0366, 1.0485, 1.0585, 1.0658-1.0669, 1.0757, 1.0797, 1.0843, 1.0889, as well as the Senkou Span B (1.0440) and Kijun-sen (1.0342) lines. The Ichimoku indicator lines may shift during the day, which should be considered when determining trading signals. It's essential to set a Stop Loss at breakeven if the price moves 15 pips in your favor to protect against potential losses if the signal proves to be false.
The day's highlight will be the German inflation report, which could provide insights into the upcoming eurozone inflation data set to be released the following day. However, the impact of German inflation on the market is likely to be limited. Similarly, we do not expect a strong reaction from traders regarding the second estimates of services sector PMIs for Germany, the EU, and the US. Overall, the currency pair is expected to continue its recovery toward the critical line.
Illustration Explanations:
- Support and Resistance Levels (thick red lines): Thick red lines indicate where movement may come to an end. Please note that these lines are not sources of trading signals.
- Kijun-sen and Senkou Span B Lines: Ichimoku indicator lines transferred from the 4-hour timeframe to the hourly timeframe. These are strong lines.
- Extreme Levels (thin red lines): Thin red lines where the price has previously bounced. These serve as sources of trading signals.
- Yellow Lines: Trendlines, trend channels, or any other technical patterns.
- Indicator 1 on COT Charts: Represents the net position size for each category of traders.
RobotFX


 Download NOW!
No comments:
Post a Comment