
Crude Oil (CL)
On the weekly chart, the price only briefly declined below the MACD indicator line before rebounding. The new trading week opened above this line, and the price is now testing resistance at 71.44. The Marlin oscillator's signal line is turning upward from the zero level, indicating potential upside momentum.
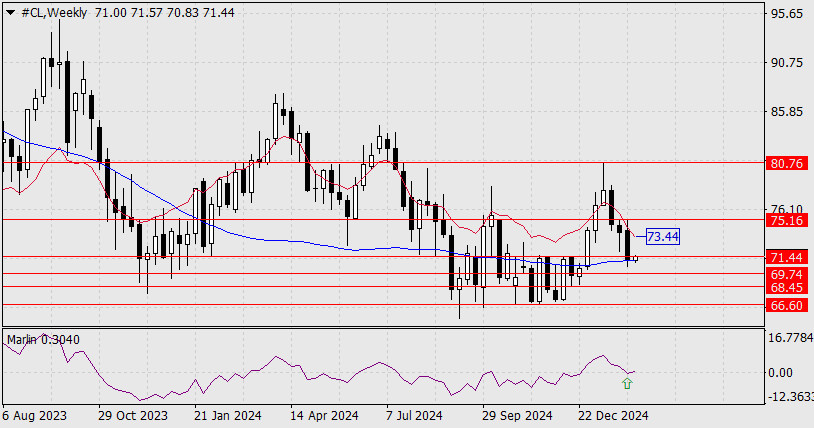
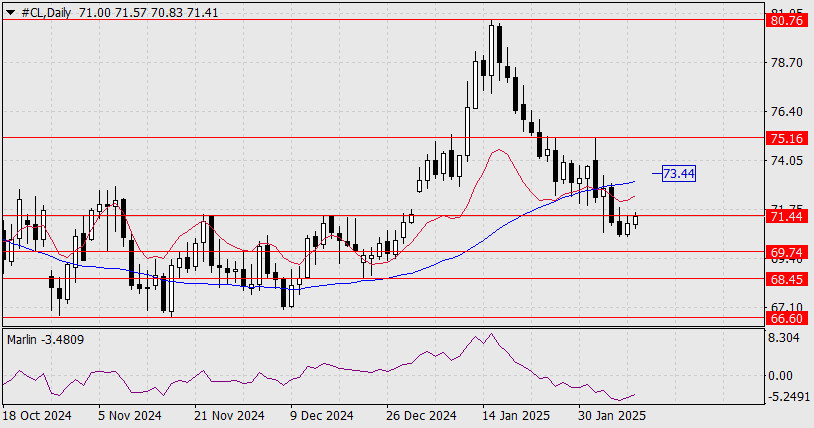
Given this technical setup, further declines toward 69.74 and 68.45 may not materialize. Instead, there is a higher probability of a rally toward 75.16.A break and consolidation above 71.44 will open the way toward the MACD line resistance at 73.44. If the price holds above 73.44, the next upward target will be 75.16.
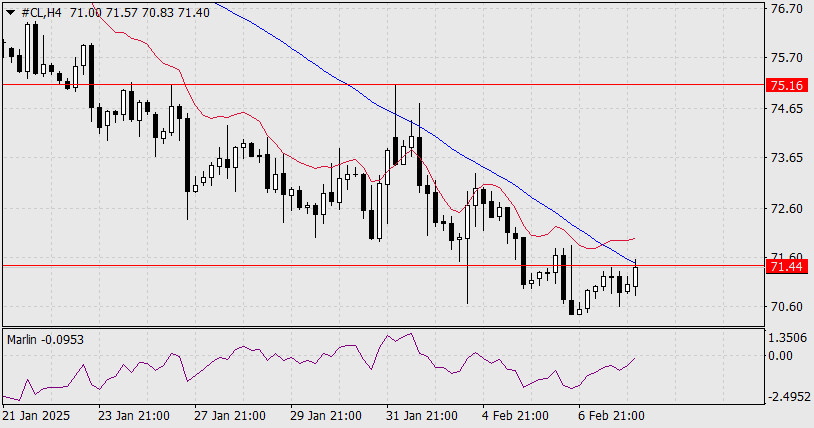
On the H4 timeframe, the MACD line is pressing against the 71.44 level from above, making it a key resistance zone. A confirmed breakout above this level would reinforce the bullish outlook, significantly strengthening buyers' positions. By the time this occurs, the Marlin oscillator is expected to enter positive territory, further supporting upward momentum.
Overall, the technical structure suggests a bullish shift, with key resistance levels 73.44 and 75.16 as potential targets.
The material has been provided by InstaForex Company - www.instaforex.comRobotFX


 XAU/USD Technical Market Overview As of May 22, 2026, XAU/USD is trading near $4,523, confined within an ascending trend channel on the H1 t...
 EUR/USD Market Overview The EUR/USD pair is currently trading near 1.1611, maintaining a position above the 3/8 Murray line. While the pair ...
 Bitcoin Technical Outlook Bitcoin is currently trading near $79,737, showing signs of a potential rebound after testing the lower boundary o...
 Gold Price Consolidation Analysis Gold is currently trading near $4,715, maintaining a position above the 7/8 Murray line. This consolidatio...


 Download NOW!
No comments:
Post a Comment