
Technical Analysis of Intraday Price Movement of Nasdaq 100 Index, Thursday June 12, 2025.
Technical Analysis of Intraday Price Movement of Nasdaq 100 Index, Thursday June 12, 2025.
On the 4-hour chart of the
The premium article will be available in
00:00:00The premium article will be available in00:00:00
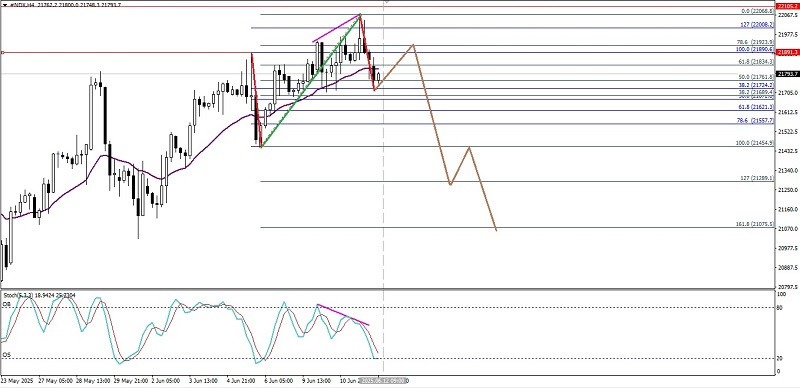
On the 4-hour chart of the Nasdaq 100 index, there is a divergence between its price movement and the Stochastic Oscillator indicator, especially with the current confirmation of the price movement of #NDX which is moving below the EMA (21), then the greater the possibility for the index to weaken in the near future to the level of 21454.9, and if this level is successfully broken and closes below it, then #NDX will continue to weaken again to the level
Fresh articles are available only to premium users
Read analytics in early access, getting information first
Get


 Strait of Hormuz Geopolitics and Market Stability Renewed tensions in the Strait of Hormuz have introduced significant uncertainty into glob...
 GBP/USD Market Overview The GBP/USD currency pair continues to exhibit low volatility, reflecting a market currently defined by inaction rat...
 EUR/USD Market Performance On Monday, the EUR/USD pair experienced a marginal gain but failed to sustain a breach above the 1.1409 resistanc...
 Central Bank Strategy Shifts Toward Dedollarization A recent survey by the Official Monetary and Financial Institutions Forum (OMFIF) reveal...
 US Equity Market Overview US equity indices concluded the second quarter with notable gains, as the S&P 500 rose 0.79% and the Nasdaq 10...


 Download NOW!
No comments:
Post a Comment