
GBP/USD. Technical Analysis for the Week of July 28 – August 2
GBP/USD. Technical Analysis for the Week of July 28 – August 2
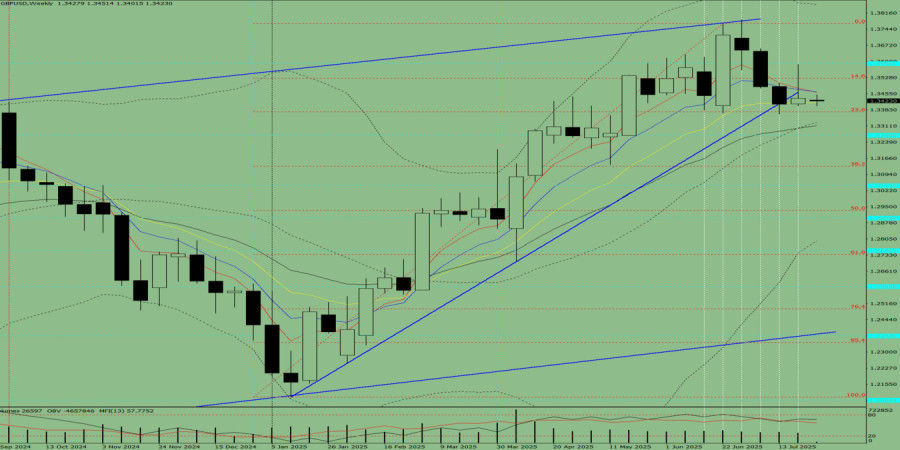
Trend AnalysisThis week, the price may
The premium article will be available in
00:00:00The premium article will be available in00:00:00
Trend AnalysisThis week, the price may begin a downward movement from the 1.3435 level (close of the last weekly candle), targeting 1.3269 – a historical support level (blue dashed line). Upon testing this level, the price may initiate an upward correction toward 1.3410 – the 21-period EMA (thin black line). Figure 1 (Weekly Chart)Comprehensive Analysis:Indicator analysis – downwardFibonacci levels – downwardVolume – downwardCandlestick analysis – downwardTrend analysis – downwardBollinger Bands – downwardMonthly chart – downwardConclusion from the Comprehensive Analysis:
Fresh articles are available only to premium users
Read analytics in early access, getting information first
Get


 Market Overview and Technical Outlook Crude oil is currently trading near $92.94, showing signs of a rebound following a double bottom forma...
 Bitcoin Technical Outlook Bitcoin is currently trading near $79,737, showing signs of a potential rebound after testing the lower boundary o...
 Gold prices experienced a sharp reversal during Tuesday's Asian trading session, retreating toward the $4,696 per ounce level. This decl...
 Market Overview and Geopolitical Influence The EUR/USD pair is exhibiting a moderate upward bias as market sentiment shifts following report...
 Market Overview and Geopolitical Factors Gold prices remain under pressure as rising Brent crude oil futures, fueled by escalating tensions ...


 Download NOW!
No comments:
Post a Comment