
Technical Analysis for July 2025 on the GBP/USD Currency Pair
Trend Analysis:
In July, the price may continue to rise from the 1.3769 level (closing price of the June monthly candle) toward the target at 1.3816 — the resistance line (thick blue line). Upon testing this line, the price may retrace downward to the 14.6% retracement level at 1.3523 (red dashed line).
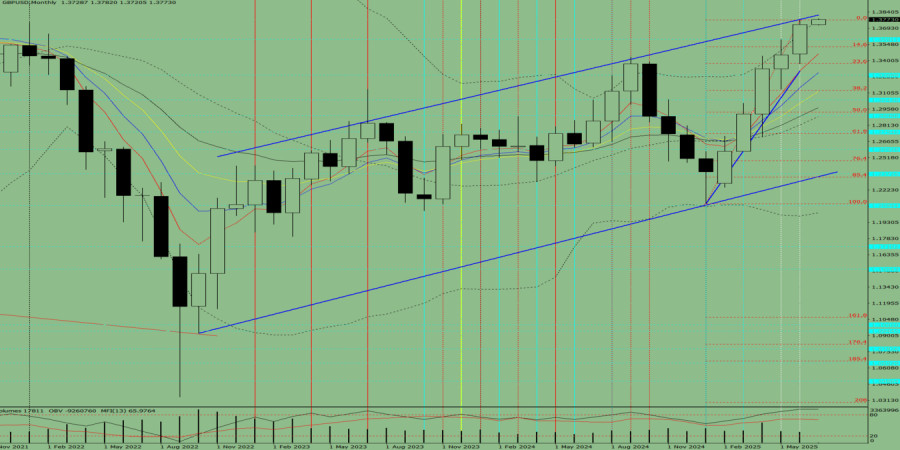
Fig. 1 (Monthly Chart).
Indicator Analysis:
- Indicator-based analysis – downward
- Fibonacci levels – downward
- Volumes – downward
- Candlestick analysis – downward
- Trend analysis – downward
- Bollinger Bands – downward
Conclusion from the comprehensive analysis: a downward trend is possible.
Overall forecast for the GBP/USD monthly candle: the price is likely to show a downward trend, with an upper shadow on the monthly black candle (first week of the month – white) and a lower shadow (last week of the monthly candle – white).
Alternative Scenario:From the 1.3769 level (closing price of the June monthly candle), the price may continue to rise toward the 1.3816 resistance line (thick blue line). Upon testing this line, the price may retrace downward toward the 1.3591 level — a historical resistance level (light blue dashed line).
Analytical expert of InstaForex
© 2007-2025


 Market Overview and Technical Context The EUR/USD pair is currently under downward pressure as the U.S. dollar benefits from a hawkish Feder...
 Gold Price Dynamics and Technical Outlook Gold (XAU/USD) is currently trading near $4,335, actively testing the upper boundary of an ascendi...
 GBP/USD Market Overview The GBP/USD currency pair continues to exhibit low volatility, reflecting a market currently defined by inaction rat...
 XAU/USD Technical Market Overview Gold (XAU/USD) continues to face significant selling pressure as it struggles to maintain its intraday reb...
 Market Overview and Current Trends The EUR/JPY pair is currently trading near the 184.00 level, reflecting significant market indecision. Th...


 Download NOW!
No comments:
Post a Comment