
The Nasdaq 100 Index will attempt to test its nearest resistance level today, Thursday, July 31, 2025.
The Nasdaq 100 Index will attempt to test its nearest resistance level today, Thursday, July 31, 2025.
Nasdaq 100 Index – Thursday, July
The premium article will be available in
00:00:00The premium article will be available in00:00:00
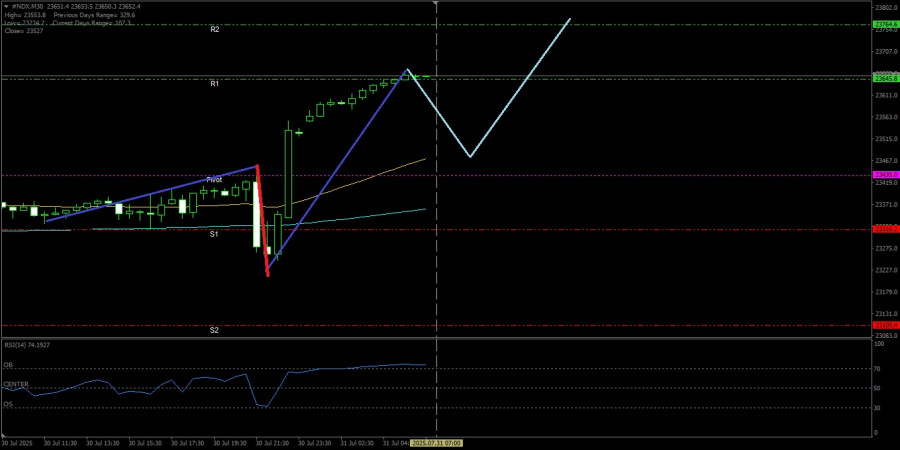
Nasdaq 100 Index – Thursday, July 31, 2025.With the Golden Cross of the 50-day (EMA)50 and (EMA)200 and the position of RSI (14)in an Extreme Bullish condition, the Nasdaq 100 Index is dominated by buyers today.Key Levels1. Resistance 2: 23764.62. Resistance 1: 23645.83. Pivot: 23435.04. Support 1: 23316.25. Support 2: 23105.4Tactical ScenarioPositive Reaction Zone: If the Nasdaq 100 Index can stay above 23435.0, then it has the potential to strengthen and rise to 23645.8.Momentum Extension Bias: If the 23645.8 level
Fresh articles are available only to premium users
Read analytics in early access, getting information first
Get


 Bitcoin Technical Outlook Bitcoin is currently trading near $79,737, showing signs of a potential rebound after testing the lower boundary o...
 Market Overview and Technical Outlook Crude oil is currently trading near $92.94, showing signs of a rebound following a double bottom forma...
 Gold prices experienced a sharp reversal during Tuesday's Asian trading session, retreating toward the $4,696 per ounce level. This decl...
 Market Overview and Geopolitical Factors Gold prices remain under pressure as rising Brent crude oil futures, fueled by escalating tensions ...
 Gold Price Consolidation Analysis Gold is currently trading near $4,715, maintaining a position above the 7/8 Murray line. This consolidatio...


 Download NOW!
No comments:
Post a Comment