
EUR/USD. Technical Analysis for October 2025
Trend Analysis
In October, from the level of 1.1732 (closing of the September monthly candle), the price may continue moving upward with the target at 1.1918 – the upper fractal (yellow dashed line). From this level, a corrective move downward is possible with the target at 1.1664 – the 14.6% retracement level (yellow dashed line).
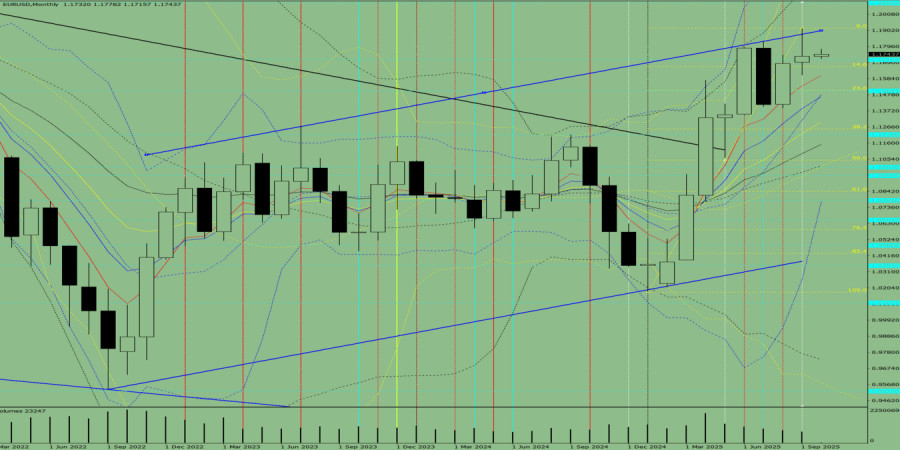
Fig. 1 (monthly chart).
Indicator Analysis:
- Indicator analysis – upward;
- Fibonacci levels – upward;
- Volumes – upward;
- Candlestick analysis – upward;
- Trend analysis – upward;
- Bollinger Bands – upward.
Comprehensive analysis conclusion: an upward trend is possible.
Overall outcome for the EUR/USD monthly candle calculation: the price will most likely have an upward trend, with the absence of the first lower shadow of the monthly white candle (first week of the month – white) and the presence of the second upper shadow (last week of the month – black).
Alternative scenario: from the level of 1.1732 (closing of the September monthly candle), the price may continue moving upward with the target at 1.2084 – the upper fractal (blue dashed line). From this level, a downward move is possible with the target at 1.1710 – the historical resistance level (blue dashed line).
Analytical expert of InstaForex
© 2007-2025


 The cryptocurrency market continues to face significant downward pressure, with Bitcoin declining 17% and Ethereum falling 21% this week. Th...
 US Dollar Market Overview The US dollar has sustained a period of strength, yet market participants are now evaluating the potential for a c...
 Market Overview and Technical Context The USD/JPY pair currently exhibits consolidation as market participants await potential intervention ...
 US Inflation and Monetary Policy Expectations Recent data confirms that US inflation has surged to 4.2%, significantly above the Federal Res...
 Market Overview EUR/USD faces significant volatility in the coming week, with traders monitoring critical U.S. inflation data and the upcomi...


 Download NOW!
No comments:
Post a Comment