
Trend Analysis (Fig. 1).On Tuesday, the market, starting from the level of 1.1644 (yesterday's daily candle close), may continue moving upward toward the target of 1.1686 — the 38.2% retracement level (yellow dashed line). Upon testing this level, the price may pull back downward to test the support line at 1.1668 (thick red line).
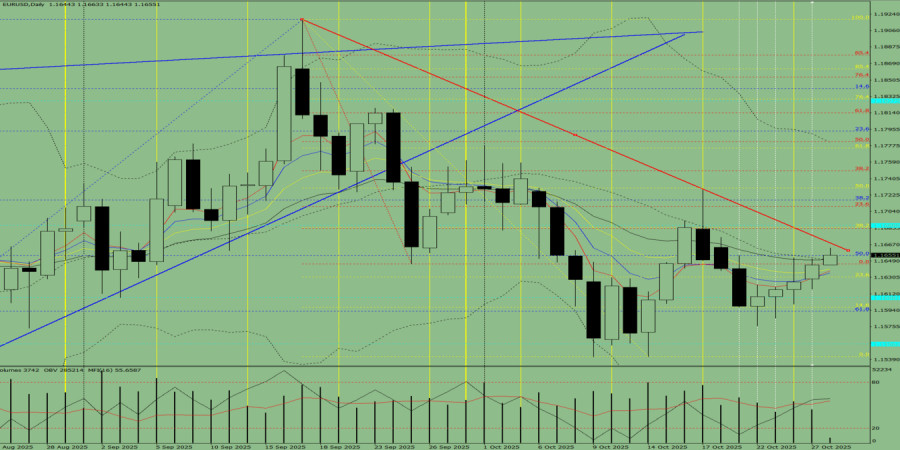
Fig. 1 (Daily Chart).
Comprehensive Analysis:
- Indicator analysis – upward;
- Volume – upward;
- Candlestick analysis – upward;
- Trend analysis – upward;
- Bollinger Bands – upward;
- Weekly chart – upward.
Overall conclusion: Upward trend.
Alternative scenario:From the level of 1.1644 (yesterday's daily candle close), the price may continue moving upward toward 1.1668 — the support line (thick red line). Upon testing this line, the price may pull back downward toward 1.1645 — the upper fractal (red dashed line).
The material has been provided by - RobotFX.Org


 Market Overview and Technical Status Ethereum (ETH/USD) is currently trading at approximately $1,786. The asset is maintaining a position ab...
 Technical Overview and Price Action The EUR/USD pair is exhibiting a rebound from the 1.1409 Fibonacci support level on the hourly chart, cu...
 Market Overview and Technical Outlook As of July 3, 2026, the EUR/USD pair is trading at 1.1442, maintaining a position above the 21-period ...
 Geopolitical Tensions in the Strait of Hormuz The situation at the Strait of Hormuz has intensified as Iran continues to restrict passage, c...
 Market Overview and Geopolitical Influence Financial markets have shifted focus toward the escalating US-Iran conflict near the Strait of Ho...


 Download NOW!
No comments:
Post a Comment