
Trend Analysis (Fig. 1)
On Friday, the market may continue moving downward from the 1.3150 level (the closing price of yesterday's daily candle) toward the 1.3115 target — the lower fractal (daily candle from October 30, 2025). Upon testing this level, a pullback movement upward toward 1.3148 is possible — a historical resistance level (blue dotted line).
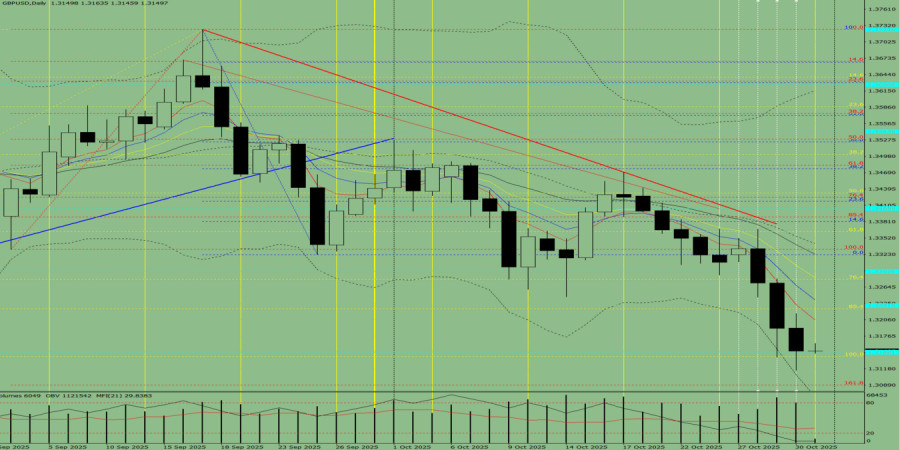
Fig. 1 (Daily Chart)
Comprehensive Analysis:
- Indicator analysis – downward
- Fibonacci levels – downward
- Volumes – downward
- Candlestick analysis – downward
- Trend analysis – downward
- Bollinger Bands – downward
- Weekly chart – upward
Overall conclusion: Downward trend.
Alternative scenario:From the 1.3150 level (the closing price of yesterday's daily candle), the price may continue moving downward toward 1.3089 — the 161.8% target level (red dotted line). Upon testing this level, a pullback upward movement toward 1.3115 — the lower fractal (daily candle from October 30, 2025) — is possible.
The material has been provided by - RobotFX.Org


 Market Overview and Technical Status Ethereum (ETH/USD) is currently trading at approximately $1,786. The asset is maintaining a position ab...
 Technical Overview and Price Action The EUR/USD pair is exhibiting a rebound from the 1.1409 Fibonacci support level on the hourly chart, cu...
 GBP/USD Performance and Correction Overview The GBP/USD pair reached a two-month high of 1.3557 on Wednesday before undergoing a technical p...
 Market Overview and Technical Outlook US equity markets are exhibiting signs of fatigue as concerns regarding overextended valuations in the...
 Market Overview and Geopolitical Context The EUR/USD pair is entering a week of potential volatility driven by an intersection of geopolitic...


 Download NOW!
No comments:
Post a Comment