To open long positions on GBP/USD, you need:
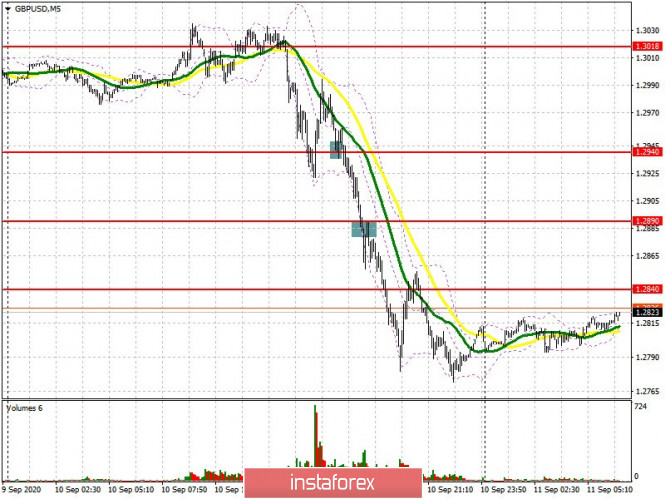
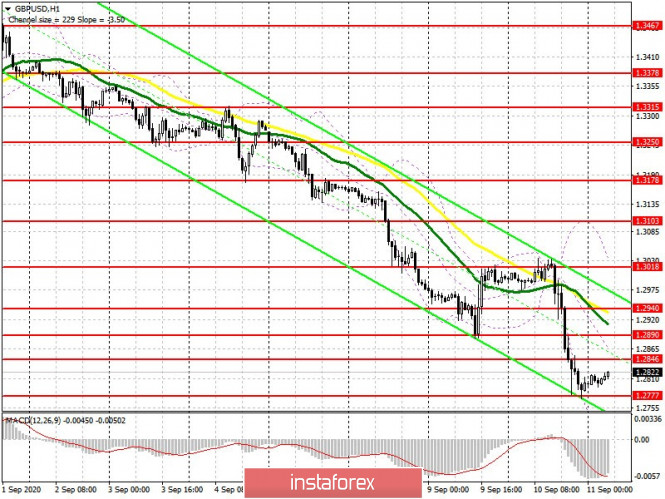
Yesterday's meeting between representatives of the EU and the UK ended in failure, which caused the British pound to fall in the afternoon. The EU said it was necessary to withdraw the bill, which violates the principles of the Brexit deal. Against this background, the bulls attempt to hold 1.2940, the test of which formed the entry point to long positions, failed. On the 5 minute chart, you can see that there was a signal to buy the pound after the bulls returned to the 1.2940 level, but this did not lead to anything good. After the bears settled under the resistance of 1.2890 in the middle of the US session, its test from the bottom up caused a sell signal to appear, which made it possible to compensate for losses from trading with a long position. At the moment, I do not recommend rushing to open long positions on the GBP/USD pair. A false breakout in the support area of 1.2777 can cause bulls to attempt building an upward correction. A more adequate solution would be to open long positions after updating the monthly low of 1.2725, subject to the same false breakout, or buying on a rebound from the 1.2675 support, based on a correction of 30-40 points within the day. An equally important task for the bulls is to return and settle at the 1.2846 level, which may cause the pair to grow to the resistance area of 1.2890, which is where I recommend taking profits. There are also moving averages that play on the side of the sellers of the pound.
Let me remind you that the Commitment of Traders (COT) reports for September 1 recorded an increase in both long and short positions, but there were more buyers. Short non-commercial positions increased from 39,790 to 42,901 over the week. Long non-commercial positions increased from 45,390 to 49,213. As a result, the non-commercial net position also slightly increased and remained in positive territory, reaching 6,312 against 5,600.

To open short positions on GBP/USD, you need:
Sellers will be more active in case data on UK GDP turns out to be weak, which could lead to a breakout and consolidating below the support of 1.2777, thereby creating a signal to sell the pound. In this scenario, you can expect a sharper decline in the area of new monthly lows of 1.2725 and 1.2675, which is where I recommend taking profits. For those who are cautious about selling at lows, it is best to wait for an upward correction, which can appear in case of good fundamental data for the UK. In this case, forming a false breakout in the resistance area of 1.2846 produces the first sell signal. However, the larger players will wait until the high of 1.2890 has been updated, so I recommend selling GBP/USD on a rebound right there. Moving averages that play on the side of the bears also pass there.

Indicator signals:
Moving averages
Trading is under the 30 and 50 moving averages, which indicates the likelihood of extending the bear market.
Note: The period and prices of moving averages are considered by the author on the H1 hourly chart and differs from the general definition of the classic daily moving averages on the D1 daily chart.
Bollinger Bands
In case the pair falls, support will be provided by the lower border of the indicator in the 1.2725 area. You can sell the pound immediately on a rebound after updating the upper limit of the indicator, which is now in the 1.2960 area.
Description of indicators
- Moving average (moving average, determines the current trend by smoothing out volatility and noise). Period 50. It is marked in yellow on the chart.
- Moving average (moving average, determines the current trend by smoothing out volatility and noise). Period 30. It is marked in green on the chart.
- MACD indicator (Moving Average Convergence/Divergence — convergence/divergence of moving averages) Quick EMA period 12. Slow EMA period to 26. SMA period 9
- Bollinger Bands (Bollinger Bands). Period 20
- Non-commercial speculative traders, such as individual traders, hedge funds, and large institutions that use the futures market for speculative purposes and meet certain requirements.
- Long non-commercial positions represent the total long open position of non-commercial traders.
- Short non-commercial positions represent the total short open position of non-commercial traders.
- Total non-commercial net position is the difference between short and long positions of non-commercial traders.


 Download NOW!
No comments:
Post a Comment