A vaccine against COVID-19 has been found, but you should not relax.
Recently, pharmaceutical giants Pfizer and Biotech announced that the testing of the COVID vaccine is coming to an end and there are positive results. Markets were flooded with emotions, stock, and commodity exchanges were flooded with positive dynamics, while Pfizer's management, according to rumors, partially dumped shares. Uncertainty in research or Pfizer's strategic move and time will tell whether it will turn to risks.
Everyone is well aware that from the moment the COVID vaccine appears to the victory over the virus, the path is thorny. From the semi-annual report of the Federal Reserve System (FRS) published yesterday, it is clear that the regulator is considering different scenarios, including a market collapse.
Of the main risks, the Federal Reserve notes that if the Coronavirus pandemic drags on longer than predicted, then the economic recovery may be undermined, as a result, financial institutions will receive a new blow, which will negatively affect the markets. Part of this is about forced business closures for quarantine and unpaid vacations.
On the territory of the European Union, where a seven-year budget of 1.8 trillion Euros was agreed yesterday, things are no better.
France and Italy have recorded the highest daily death rates from COVID since April, and the Paris region is close to running out of intensive care beds.
In Germany, the number of patients with Coronavirus in intensive care units has reached a new record. The workload of the department is just over 70% of beds, including patients without COVID. Meanwhile, preparations for vaccine distribution are increasing worldwide, as Pfizer and Biotech injections require sophisticated deep-freeze infrastructure. Thus, you should not wait for the first vaccines until next year.
In turn, the European Central Bank (ECB) signals a possible collapse of European companies, despite government support. So, from the ECB report, it follows that one in seven employees of Spanish companies is on the verge of dismissal.
"Whether the current crisis will cause long-term damage will depend, among other things, on the number and nature of companies that will collapse as a result of the lack of liquidity caused by lockdowns and restrictive measures," the ECB report said
The material shows that the appearance of the vaccine is good news, but do not expect rapid changes. The markets, as before, are at high risk of a new collapse.
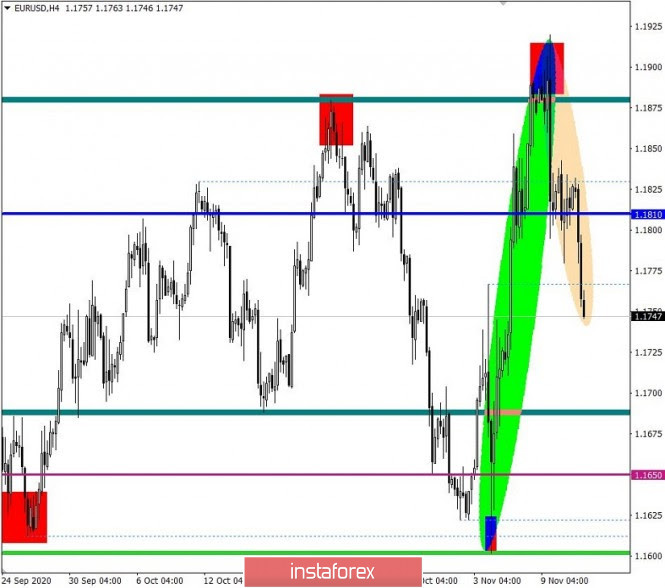
In terms of technical analysis, you can see that the echoes of speculation continue to appear in the market. A good example is the first half of the previous day, where a sharp strengthening of the US Dollar against the Euro occurred during the period 10: 45-12: 45* (time at the trading terminal*). As a result, the quote overcame the local minimum of November 9 which was 1.1795 and fell to the area of 1.1780 where there was a stop and then a return to the point of inertia. In fact, the market reflected a surge followed by stagnation, echoes of which are observed during the Asian session of the subsequent trading day.
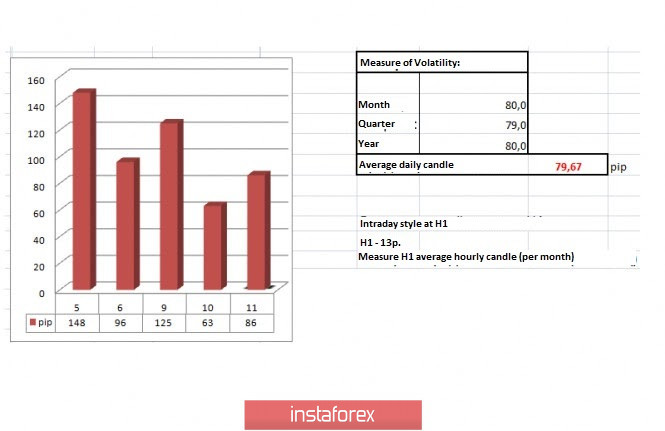
As for the market dynamics for November 10, this is the first slowdown in five trading days of 63 points, which is 20% below the average level. It is worth considering that even with such a significant decrease in daily activity, local dynamics are at a positive level, which is confirmed by a high coefficient of speculative operations, as well as impulse jumps on the trading chart.
Looking at the trading chart in general terms (daily period), you can see the first signals of the upcoming correction move relative to the past week. Candlesticks from November 6 and 9 were used as tools, which reflect the bearish absorption pattern. This signal in the interpretation of candle analysis indicates a possible downward movement in the market, in this case it may be the beginning of a corrective move.

Today, in terms of the economic calendar, we do not have the publication of important statistical indicators. The market will focus on technical analysis, as well as information flow, depending on the category of its importance.
Analyzing the current trading chart, you can see that with the start of the European session, there was a speculative demand for the US Dollar, which led to a breakdown of the local minimum of the previous day of 1.1780 and sellers managed to once again strengthen their positions.
In fact, we have a prolongation of the correction course from the local maximum of 1.1920, where in the future there may be a change of status from a correction to a recovery process relative to the upward inertia course of the past week.
Holding the quote below the price level of 1.1810 strengthens the position of sellers and a sequential descent confirms the expectations of the specified position.
It can be assumed that speculative demand for the US Dollar will continue in the market where it is possible that a consistent update of local lows will eventually lead to a full recovery relative to the upward course of the past week. In other words, the sellers' benchmark is 1.1650 and 1.1600.
An alternative scenario for market development will be considered if the quote returns above the level of 1.1810 where buy positions are placed in the area of 1.1850.

Indicator analysis
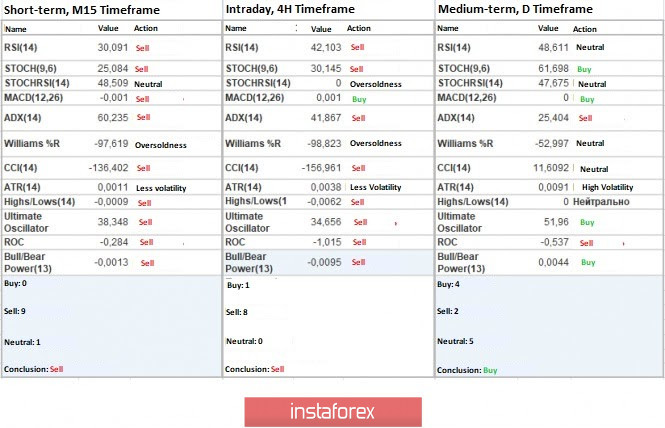
Analyzing a different sector of timeframes (TF), it is clear that the indicators of technical instruments on the minute and hour intervals are already actively taking a downward position, signaling a sale. The daily interval is on the verge of changing direction from ascending to descending, which is justified due to the recovery process.

The volatility for the week / measurement of volatility: Month, Quarter, and Year
The measurement of volatility reflects the average daily fluctuation, calculated for the Month, Quarter, and Year.
(November 11 was based on the time of publication of the article)
The dynamics of the current time is 86 points, which is already 8% higher than the average level. We can assume that the growth of activity may still continue to the borders of 100-120 points.

Key level
Resistance zones: 1,1810*; 1,1910; 1,2000***; 1,2100*; 1,2450**; 1,2550; 1,2825.
Support areas: 1,1700; 1,1612*;1,1500; 1,1350; 1,1250*;1,1180**; 1,1080; 1,1000***.
* Periodic level
* * Range level
***Psychological level
The material has been provided by InstaForex Company - www.instaforex.com


 Download NOW!
No comments:
Post a Comment