USD/JPY
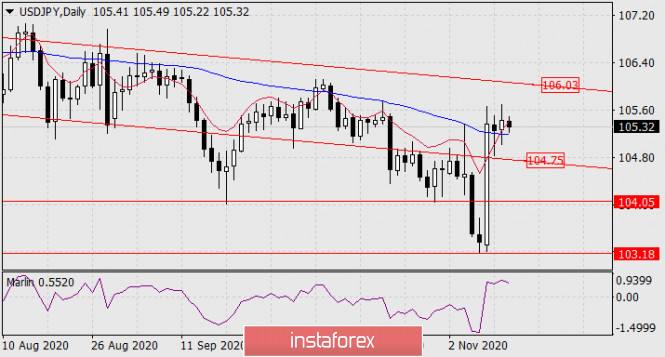
On the daily chart for the third day, the Japanese yen is held above the MACD line. The Marlin oscillator is developing in a small horizontal range, increasing the probability of price growth to the nearest target of 106.03 along the price channel line.

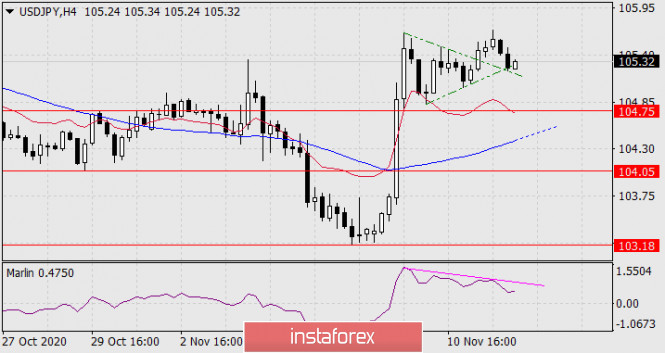
But this plan has an alternative, which manifests itself when considering the situation on a four-hour scale. Yesterday, the price went up from the triangle, then returned to its top, converting the triangle into a flag.

Meanwhile, a divergence was formed based on Marlin. Since the price is close to going under the forming lines of the flag and triangle, working out the target level of 104.75 is possible. By this time, the Marlin oscillator on the daily timeframe may be in the zone of negative values. Fixing the price at 104.75 will open the target of 104.05 at the minimum on September 21. If the price is fixed at 104.75, the MACD line on H4 can be easily overcome by increasing dynamics. The probability of both upward and downward development is the same, and the uncertainty can be resolved today.
The material has been provided by InstaForex Company - www.instaforex.com


 Download NOW!
No comments:
Post a Comment