GBP/USD 5-Minute Analysis

The GBP/USD currency pair saw a slight increase on Wednesday. Currently, the technical outlook for both the euro and the pound appears nearly identical. The key distinction is that the British pound has not yet broken through the Senkou Span B line. According to the Ichimoku indicator, a downward trend still prevails for the pound. We wouldn't be surprised if both the euro and the pound resume their declines today or tomorrow, as we still don't see any compelling reasons for them to strengthen against the dollar. The Bank of England may begin actively cutting its key interest rate as early as next week. Additionally, the "Trump factor" may not be inherently negative for the dollar. It raises the question of why everyone assumes that tariffs are detrimental to the U.S. economy. It seems that Trump intends to implement these tariffs to improve conditions for the country.
Recently, the pound sterling has corrected by 250 pips but shows little intention of continuing this upward movement. On the daily timeframe, such a correction is minor and nearly imperceptible on the charts. It's essential to note that this timeframe primarily indicates the need for a correction, especially after nearly four months of sustained decline. Thus, yesterday can be viewed as a semi-holiday for the currency. The British pound may continue to correct for several more weeks; however, there are currently no signals indicating a resumption of the downtrend.
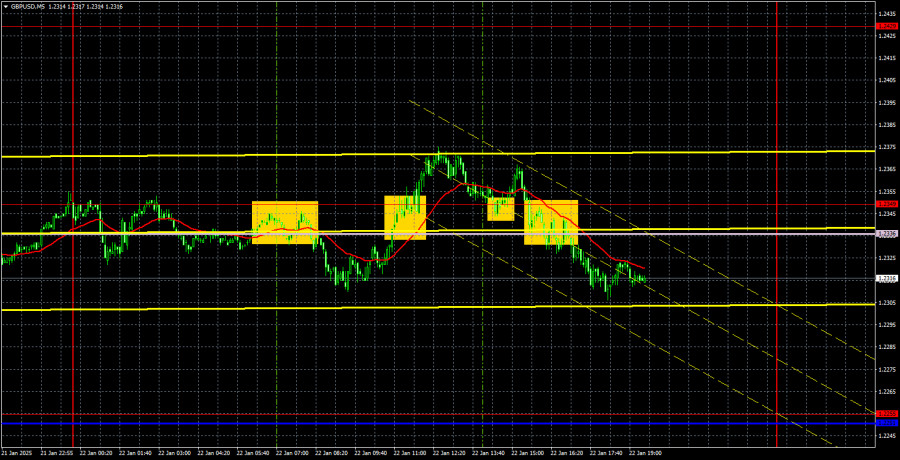
Wednesday's trading signals were weak, with the pound trading sideways throughout the day, frequently fluctuating in the 1.2336–1.2349 range. Unfortunately, this sideways movement can occur from time to time. As we mentioned earlier, the current price activity is corrective in nature, making it extremely challenging to expect clear signals that could yield 50–100 pips in profits during this correction. The nature of such movements simply does not allow for significant gains.
COT Report

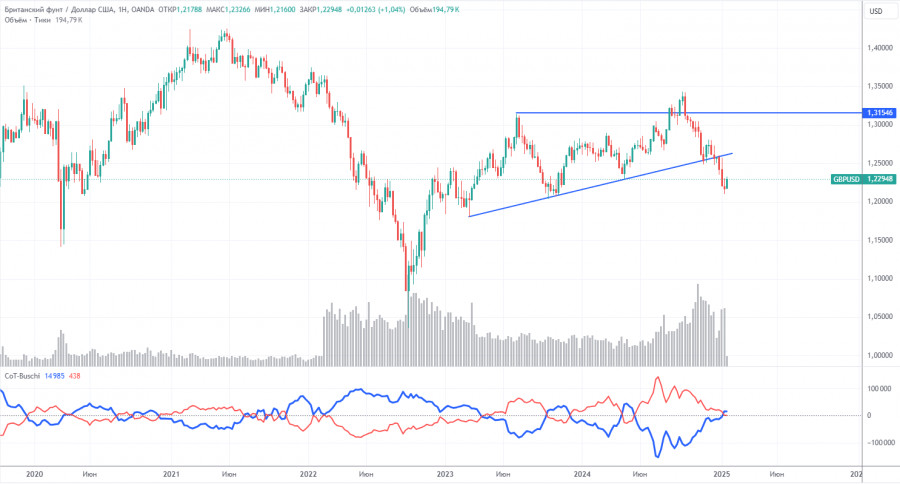
COT reports on the British pound show that the sentiment among commercial traders has been constantly changing in recent years. The red and blue lines in the reports, representing the net positions of commercial and non-commercial traders, frequently intersect and are typically close to the zero mark. Currently, these lines are near each other, suggesting there are approximately equal numbers of long and short positions.
On the weekly timeframe, the price initially broke through the 1.3154 level and then dropped to the trend line, which it successfully breached. Breaking this trend line suggests a high probability of the pound's continued decline. This concerns the long-term perspective.
According to the latest COT report, the "Non-commercial" group closed 700 buy contracts and opened 13,300 sell contracts. As a result, the net position of non-commercial traders decreased by 12,600 contracts over the week, which is negative for the pound.
The fundamental outlook still does not provide any support for long-term purchases of the pound sterling. The currency has a strong likelihood of resuming its global downward trend. Thus, the net position may continue to decline, indicating a reduced demand for the pound sterling.
GBP/USD 1-Hour Analysis

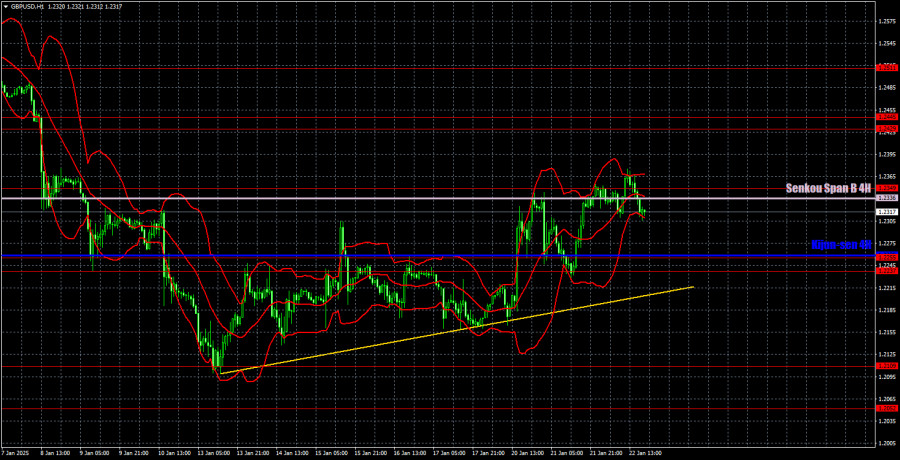
On the hourly timeframe, the GBP/USD pair generally maintains a bearish outlook. The recent upward trend is not expected to result in a significant increase in the value of the British currency. We do not foresee any factors that could support a rise in the pound, except for the occasional need for technical corrections. This pattern of weak corrections followed by strong declines has been consistently observed week after week. In the medium term, we still anticipate that the pair will move toward $1.1800, although there are currently no signals indicating a resumption of the downtrend.
For January 23, the following important levels are highlighted: 1.2052, 1.2109, 1.2237–1.2255, 1.2349, 1.2429–1.2445, 1.2511, 1.2605–1.2620, 1.2691–1.2701, and 1.2796–1.2816. The Senkou Span B (1.2336) and Kijun-sen (1.2258) lines may also provide valuable signals. It is advisable to set Stop Loss orders to break-even once the price moves 20 pips in the desired direction. Please note that the Ichimoku indicator lines can shift throughout the day, which should be taken into account when determining trading signals.
There are no significant events scheduled in either the U.K. or the U.S. on Thursday, aside from a report on U.S. jobless claims, which is unlikely to evoke any market reaction due to its minor importance. We expect calm movements in the market once again, possibly resulting in a flat market.
Illustration Explanations:
- Support and Resistance Levels (thick red lines): Thick red lines indicate where movement may come to an end. Please note that these lines are not sources of trading signals.
- Kijun-sen and Senkou Span B Lines: Ichimoku indicator lines transferred from the 4-hour timeframe to the hourly timeframe. These are strong lines.
- Extreme Levels (thin red lines): Thin red lines where the price has previously bounced. These serve as sources of trading signals.
- Yellow Lines: Trendlines, trend channels, or any other technical patterns.
- Indicator 1 on COT Charts: Represents the net position size for each category of traders.
RobotFX


 Download NOW!
No comments:
Post a Comment