EUR/USD 5-Minute Analysis

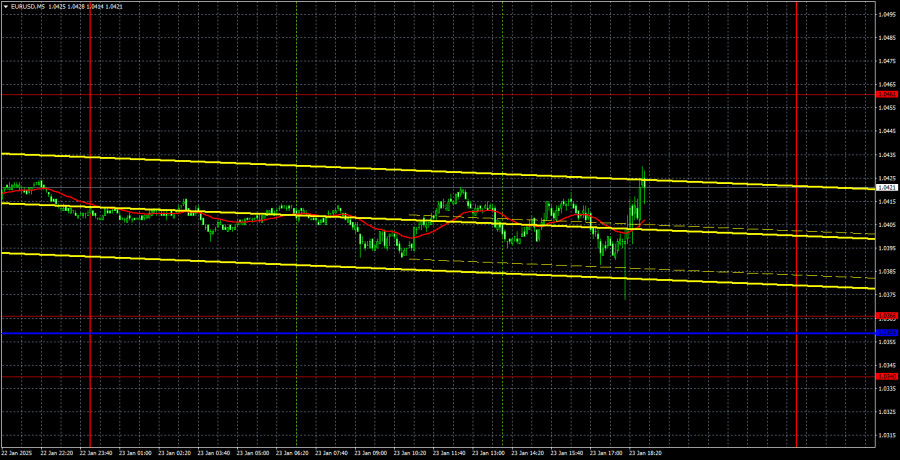
The EUR/USD currency pair stood still almost all day on Thursday. Movement was only observed during the U.S. trading session, and even then, it was not influenced by the day's only macroeconomic report—U.S. unemployment claims. The actual figures were very close to the forecast, which left the market with little to react to. U.S. trading sessions are typically more volatile due to higher trading volumes, which explains the slight increase in activity. However, this movement did not alter the overall technical outlook.
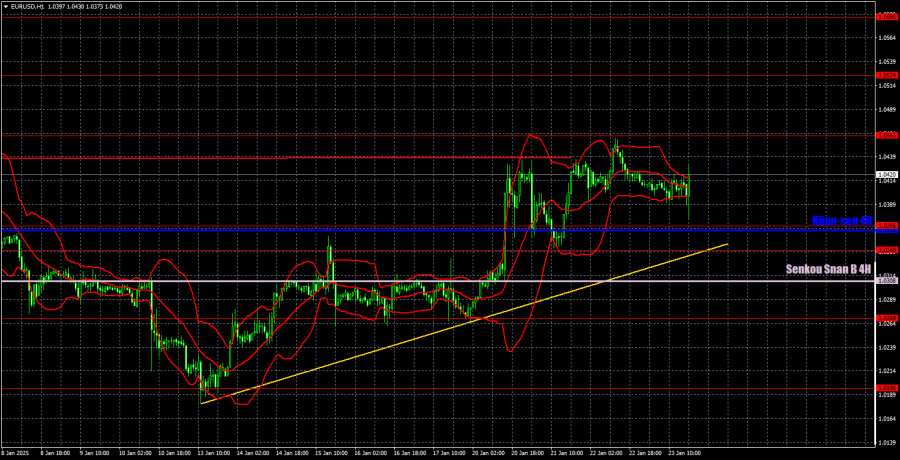
The price continues to stay above the Ichimoku indicator lines and the trendline, maintaining the ongoing upward correction. Nevertheless, it is struggling to break through the critical 1.0439–1.0461 range, which is essential for further growth, even if only incremental. The euro has not gained any new growth drivers this week, while the U.S. dollar has remained stable, resulting in no fundamental changes. Additionally, this is not the only thing currently lacking.
No trading signals were generated on Thursday, which could be seen as a positive outcome since the price mostly moved sideways during the day. As illustrated in the accompanying chart, any potential trading signals might have led to losses rather than profits. Trading during a correction is generally not ideal, and there has been no significant intraday upward movement in the euro that would yield substantial profits.
COT Report

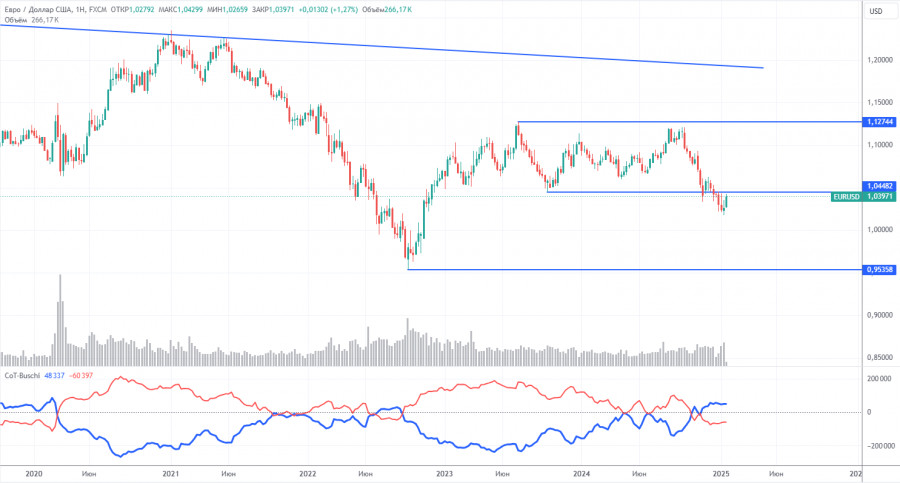
The latest COT report, dated January 14, indicates that the net position of non-commercial traders has consistently leaned towards a bullish stance. However, bears have recently taken the lead. Two months ago, there was a significant increase in the number of open short positions held by professional traders, resulting in a net position that turned negative for the first time in a considerable period. This suggests that the euro is being sold more frequently than it is being purchased.
Currently, we do not observe any fundamental factors that could support a strengthening of the euro. Technical analysis consistently shows that the price has remained in a consolidation zone, essentially demonstrating a flat trend. On the weekly timeframe, it is evident that since December 2022, the pair has fluctuated between the levels of 1.0448 and 1.1274. However, breaking below the 1.0448 level has opened up new opportunities for further decline.
At present, the red and blue lines have crossed and reversed their positions concerning each other, signaling a bearish trend in the market. During the last reporting week, the number of long positions in the "Non-commercial" category decreased by 3,700 contracts, while short positions dropped by 7,400 contracts. Consequently, the net position increased slightly by 3,700 contracts.
EUR/USD 1-Hour Analysis

On the hourly timeframe, the currency pair has initiated a new upward trend, which appears to be merely a correction. We believe that the euro's decline will resume in the medium term regardless of this correction. The Federal Reserve is expected to cut rates only 1–2 times in 2025, indicating a more hawkish stance than what the market initially anticipated. This, along with other factors, will continue to support the U.S. dollar. The end of this technical correction can be identified once the price settles below the Ichimoku lines and the trendline.
For January 24, the following trading levels are highlighted: 1.0124, 1.0195, 1.0269, 1.0340–1.0366, 1.0461, 1.0524, 1.0585, 1.0658–1.0669, 1.0757, 1.0797, and 1.0843, along with the Senkou Span B (1.0308) and Kijun-sen (1.0361) lines. Please note that the Ichimoku indicator lines may shift throughout the day, so traders should take this into account when identifying signals. Additionally, it's important to set a Stop Loss order to breakeven if the price moves 15 pips in your desired direction. This helps protect against potential losses if the signal turns out to be false.
On Friday, both the Eurozone and the U.S. will release PMI data for the services and manufacturing sectors for January. Additionally, the University of Michigan Consumer Sentiment Index will be published in the U.S. This makes today the most eventful day of the week in terms of macroeconomic releases. However, the significance of these reports may not be strong enough to trigger substantial market movements. If the data diverges sharply from forecasts, the market may react, but it's unlikely that the technical picture will undergo a significant shift today.
Illustration Explanations:
- Support and Resistance Levels (thick red lines): Thick red lines indicate where movement may come to an end. Please note that these lines are not sources of trading signals.
- Kijun-sen and Senkou Span B Lines: Ichimoku indicator lines transferred from the 4-hour timeframe to the hourly timeframe. These are strong lines.
- Extreme Levels (thin red lines): Thin red lines where the price has previously bounced. These serve as sources of trading signals.
- Yellow Lines: Trendlines, trend channels, or any other technical patterns.
- Indicator 1 on COT Charts: Represents the net position size for each category of traders.
RobotFX


 We introduce you to the daily updated section of Forex analytics where you will find reviews from forex experts, up-to-date monitoring of fi...


 Download NOW!
No comments:
Post a Comment