
Technical Analysis for the Week of July 14–19: EUR/USD Currency Pair
Trend Analysis (Fig. 1)
This week, from the 1.1689 level (the close of the last weekly candle), the market may continue moving downward, aiming for 1.1536 — the 38.2% retracement level (blue dashed line). Upon testing this level, the price may begin to rise toward the target of 1.1571 — the upper fractal (red dashed line).
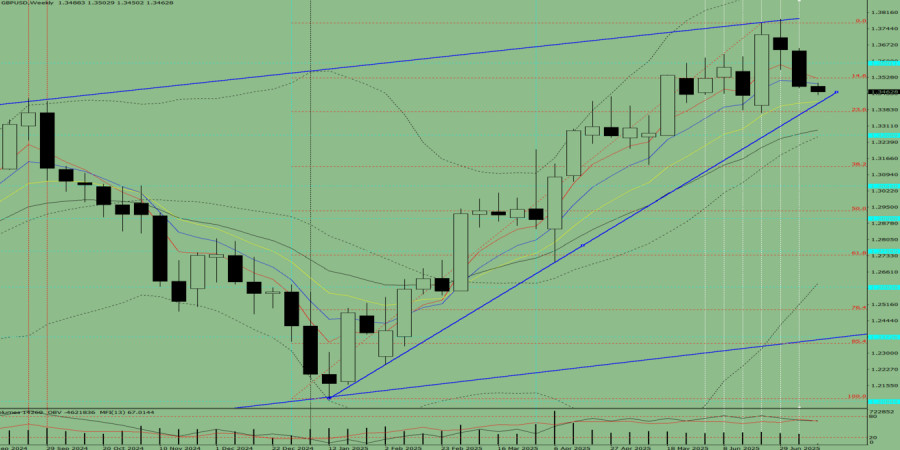
Fig. 1 (weekly chart)
Comprehensive Analysis:
- Indicator analysis – downward
- Fibonacci levels – downward
- Volume – downward
- Candlestick analysis – downward
- Trend analysis – downward
- Bollinger Bands – downward
- Monthly chart – downward
Conclusion based on comprehensive analysis: downward movement
General forecast for the EUR/USD weekly candle:The price is most likely to show a downward trend throughout the week, with no upper shadow on the weekly black candle (Monday – down) and the presence of a lower shadow (Friday – up).
Alternative scenario:The pair may continue to decline from the 1.1689 level (the close of the last weekly candle) toward the target of 1.1536 — the 38.2% retracement level (blue dashed line). If this level is tested, the price may continue downward to 1.1500 — the 85.4% retracement level (red dashed line).
Analytical expert of InstaForex
© 2007-2025


 Download NOW!
No comments:
Post a Comment