
Technical Analysis for the Week of July 14–19: GBP/USD Currency Pair
Trend Analysis
This week, from the level of 1.3487 (the close of the last weekly candle), the price may continue to decline toward the target of 1.3374 — the 23.6% retracement level (red dashed line). Upon testing this level, the price may start moving upward toward the target of 1.3420 — the 13-period EMA (thin yellow line).
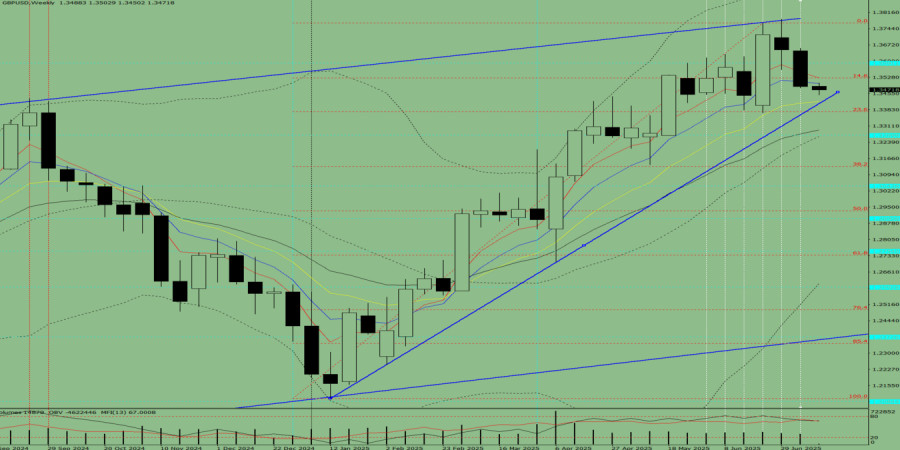
Fig. 1 (weekly chart)
Comprehensive Analysis:
- Indicator analysis – downward
- Fibonacci levels – downward
- Volume – downward
- Candlestick analysis – downward
- Trend analysis – downward
- Bollinger Bands – downward
- Monthly chart – downward
Conclusion based on comprehensive analysis: downward movement
General forecast for the GBP/USD weekly candle:The price is likely to trend downward during the week, with no upper shadow on the weekly black candle (Monday – down) and the presence of a lower shadow (Friday – up).
Alternative scenario:From the 1.3487 level (the close of the last weekly candle), the price may continue to move down toward the target of 1.3374 — the 23.6% retracement level (red dashed line). If this level is reached, the downward movement may extend further toward 1.3294 — the 21-period EMA (thin black line).
Analytical expert of InstaForex
© 2007-2025


 Gold Price Dynamics and Technical Outlook Gold (XAU/USD) is currently trading near $4,335, actively testing the upper boundary of an ascendi...
 Market Overview and Technical Context The EUR/USD pair is currently under downward pressure as the U.S. dollar benefits from a hawkish Feder...
 Fundamental Market Overview Gold (XAU/USD) is struggling to maintain upward momentum as a bearish fundamental environment limits recovery po...
 Market Outlook and Economic Context The euro and British pound remain the focus of current trading, with market participants primarily utili...
 Bitcoin Technical Analysis Overview Bitcoin (BTC/USD) currently displays a divergent technical outlook across different timeframes. While th...


 Download NOW!
No comments:
Post a Comment