

Today, gold is trading within its familiar four-day range, finding support at the 100-period Simple Moving Average (SMA) on the 4-hour chart. From a technical standpoint, any decline is likely to find solid support near the 200-period Exponential Moving Average (EMA), which currently lies around $4020. Next comes the weekly low, slightly below the psychological level of $4000; a break beneath this level would accelerate the decline toward support at $3930. The downward trajectory may continue toward a test of the late-October low near $3886.
On the other hand, the 50-period Simple Moving Average (SMA) on the 4-hour chart, located around $4110, is the nearest resistance. A modest rise above this level would be perceived as a new bullish catalyst, lifting the price of the yellow metal to the next resistance zone around $4150–4145. Further growth would pave the way toward the next psychological level at $4200.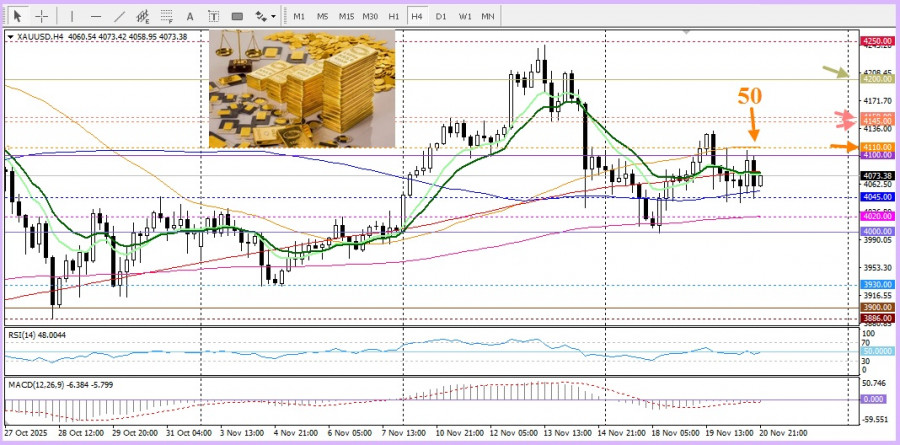 It is also worth noting that oscillators on the daily chart remain positive, confirming that gold is not ready to surrender.


 Market Overview and Technical Status Ethereum (ETH/USD) is currently trading at approximately $1,786. The asset is maintaining a position ab...
 Technical Overview and Price Action The EUR/USD pair is exhibiting a rebound from the 1.1409 Fibonacci support level on the hourly chart, cu...
 Market Overview and Technical Outlook As of July 3, 2026, the EUR/USD pair is trading at 1.1442, maintaining a position above the 21-period ...
 Geopolitical Tensions in the Strait of Hormuz The situation at the Strait of Hormuz has intensified as Iran continues to restrict passage, c...
 Market Overview and Geopolitical Influence Financial markets have shifted focus toward the escalating US-Iran conflict near the Strait of Ho...


 Download NOW!
No comments:
Post a Comment