
Keep ahead of the curve with up-to-date forex market analytics and trading signals.
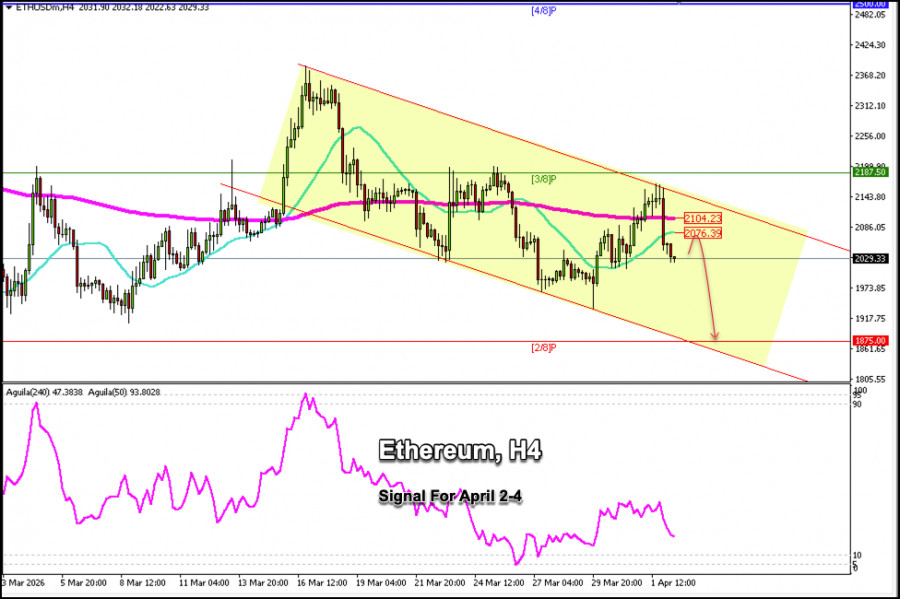
Ethereum is trading around $2,029, below the 200 EMA and the 21 SMA, showing a bearish signal after attempting to consolidate above $2,150 during Wednesday's US trading session.
As we mentioned in yesterday's analysis, ETH/USD faces strong resistance below the 3/8 Murray line, which is why it attempted to break above $2,187 but failed. Since then, a sharp technical correction has been observed, and the price could continue to fall in the coming days.
Recover from drawdowns intelligently with the Auto Recovery Expert Advisor for MT4/MT5. Perfect for hedging strategies. Learn more.
Given that Ethereum is trading below the 200 EMA and below the 21 SMA, this gives us a bearish outlook. If a rebound occurs in the coming hours toward $2,076 or $2,104, it could be seen as an opportunity to continue selling with short-term targets around the lower band of the bearish trend channel at $1,875, which also coincides with the 2/8 Murray line.
If ETH manages to break back above $2,104, we could expect it to consolidate above this zone before opening long positions. However, we should also wait for a decisive break of the downtrend channel; once both conditions are met, we could expect it to reach the 3/8 Murray level around $2,187 and eventually reach the 4/8 Murray level around $2,500.
Given that the outlook for the instrument remains bearish, any pullback in the coming days—and as long as the price trades below the 3/8 Murray line—will be seen as a signal to continue selling, with targets around $1,875; a break below this level could even lead to a drop to the psychological level of $1,500.
The material has been provided by - RobotFX.OrgThank you for reading. Level up your trading with proven RobotFX expert advisors – check them out now.


 Market Overview and Technical Status Ethereum (ETH/USD) is currently trading at approximately $1,786. The asset is maintaining a position ab...
 Technical Overview and Price Action The EUR/USD pair is exhibiting a rebound from the 1.1409 Fibonacci support level on the hourly chart, cu...
 Market Overview and Technical Outlook As of July 3, 2026, the EUR/USD pair is trading at 1.1442, maintaining a position above the 21-period ...
 Geopolitical Tensions in the Strait of Hormuz The situation at the Strait of Hormuz has intensified as Iran continues to restrict passage, c...
 Market Overview and Geopolitical Influence Financial markets have shifted focus toward the escalating US-Iran conflict near the Strait of Ho...


 Download NOW!
No comments:
Post a Comment